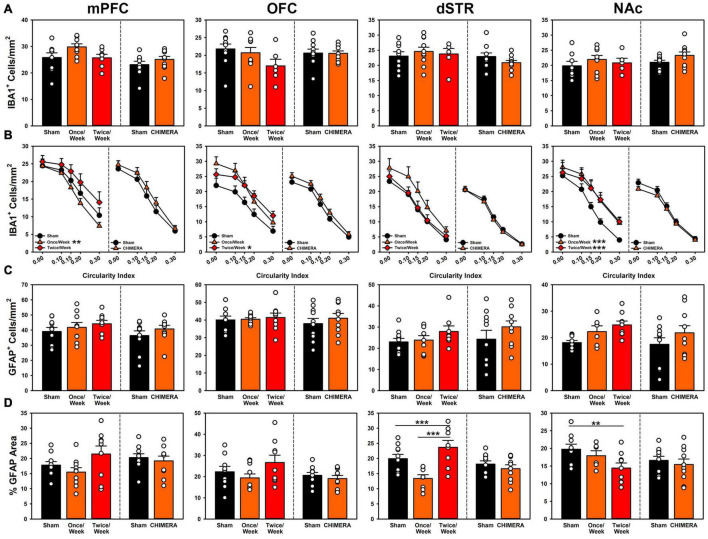
FIGURE 5.
Histopathology results from both experiments across (left to right) medial prefrontal cortex, orbitofrontal cortex, dorsal striatum and nucleus accumbens. In each panel, the left side of the dividing line is Experiment 1, and the right side Experiment 2. (A) Total microglia counts were not significantly different for any region for either experiment. (B) Microglia phenotypes for Experiment 1 were significantly more reactive for the Once/Week in PFC and NAc (p = 0.006, p < 0.001) and for the Twice/Week in OFC and NAc (p = 0.023, p < 0.001). Phenotypes remained unchanged for injuries in Experiment 2. (C) Total astrocyte counts for Experiment 1 were significantly elevated for the Twice/Week group relative to sham (p = 0.039), but not differential by ROI. There were no changes in Experiment 2. (D) Gliosis in Experiment 1 was significantly decreased for Once/Week rats in the dSTR (p < 0.001) and for Twice/Week rats in the NAc (p = 0.010). There were no changes in Experiment 2.

