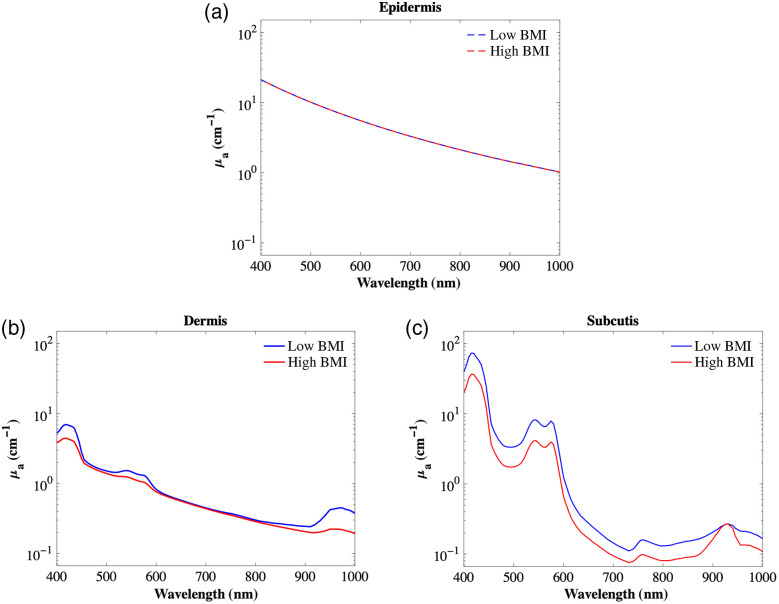
Fig. 2.
Model incorporates major abdominal chromophore’s volume fractions changes from a low BMI (baseline value) to a higher BMI (Table 4). The resulting plots model absorption coefficient for the (a) epidermis, (b) dermis, and (c) subcutis in the 400 to 1000 nm wavelength range.

