FIGURE 4.

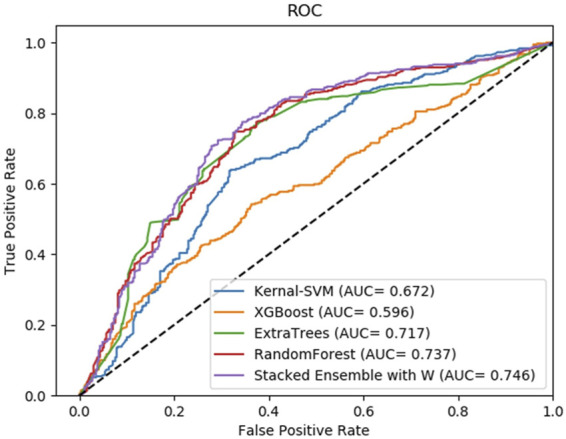
Average result of ROC curves of five-fold cross-validation with four single base classifiers and our method of stacking ensemble on RPI369 by SAWRPI. AUC expresses area under an ROC curve.

Average result of ROC curves of five-fold cross-validation with four single base classifiers and our method of stacking ensemble on RPI369 by SAWRPI. AUC expresses area under an ROC curve.