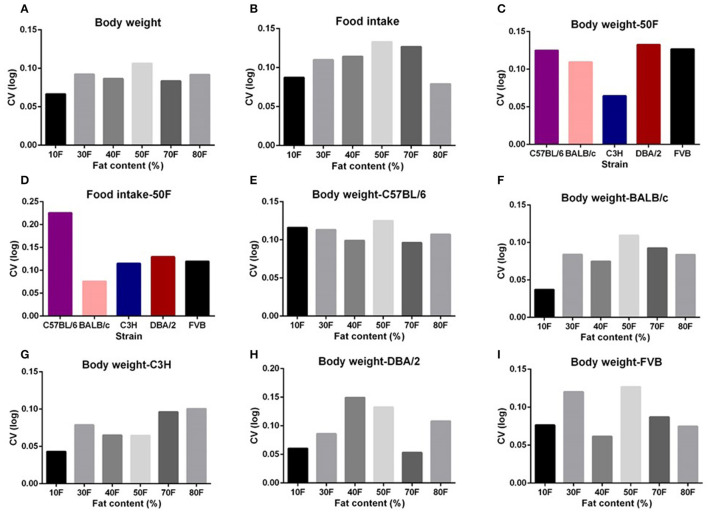
Figure 2.
The coefficient of variation (CV) of body weight and food intake of different strains and different diet treatment groups. The CV of body weight and food intake of (A,B) graded levels of fat content diet treatment group, (C,D) different strains (n = 7–21). (E–I) Variations in body weight gain (CV) of five different strains (C57BL/6, BALB/c, C3H, DBA/2, and FVB) when fed with 10, 30, 40, 50, 70, and 80% content fat diets, respectively (n = 7–21).

