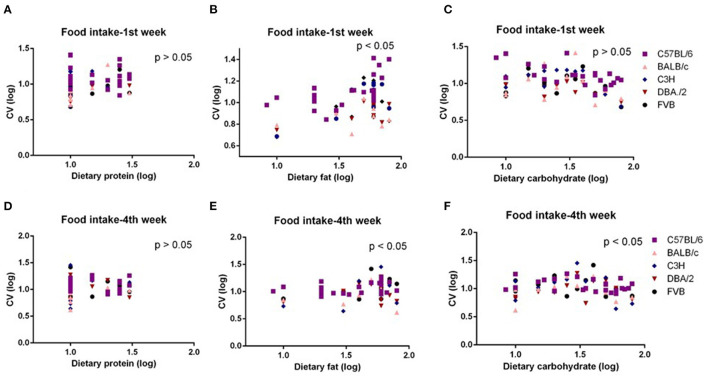
Figure 5.
The diagram showing the relationship between dietary macronutrient content and coefficient of variation (CV) of food intake of the 1st week and 4th week after exposure to different diets. The correlations between logged dietary fat, protein, and carbohydrate contents and (A–C) logged CV of food intake of the 1st week and (D–F) 4th week at different diet treatment periods, respectively (n = 7–21).

