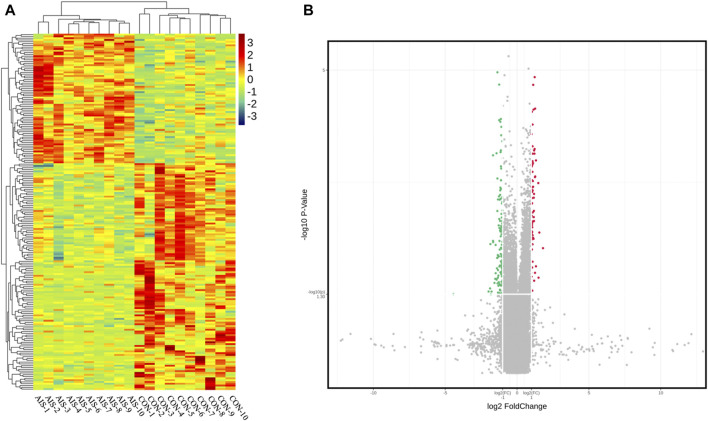
FIGURE 2.
CircRNA profiles of plasma exosomes from AIS patients (AIS) and controls (CON). (A) Heat map of circRNAs differentially quantified between AIS patients and controls. (B) Volcano plot of circRNA profiles between AIS patients and controls. Red dots represent significantly upregulated circRNAs (log2 fold change ≥ 1.00 and p < 0.05, n = 10, independent two-sample t-test), and green dots represent significantly downregulated circRNAs (log2 fold change ≤ −1.00 and p < 0.05, n = 10, independent two-sample t-test).

