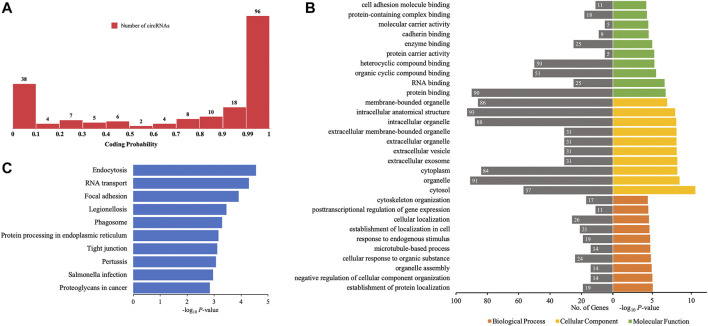
FIGURE 7.
GO annotations and KEGG pathway analyses for proteins potentially coded by differentially quantified circRNAs. (A) Distribution of the coding probability of differentially quantified circRNAs. (B) GO annotations. The GO analysis categorized the genes into different groups under the theme of biological process, cellular component, and molecular function. The gene count for each GO category is listed on the left. (C) Top 10 KEGG pathways. The vertical axis indicates the pathway category, and the horizontal axis indicates the −log10 p-value of a pathway (Fisher’s exact test).

