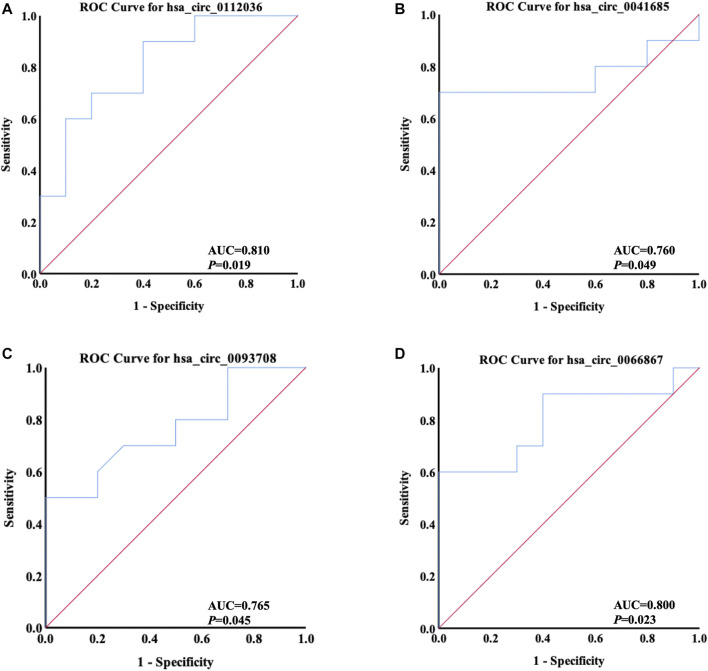
FIGURE 9.
ROC curves of four differentially quantified circRNAs verified by qRT-PCR, including ( A ) hsa_circ_0112036, ( B ) hsa_circ_0041685, ( C ) hsa_circ_0093708, and ( D ) hsa_circ_0066867 (n = 10). The red diagonal lines in the graphs represent the diagnostic threshold value of circRNAs for AIS (AUC = 0.500).

