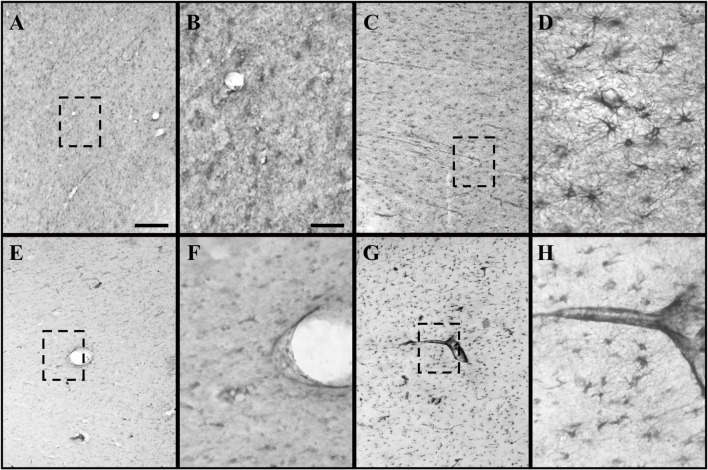
FIGURE 2.
GFAP and CRYAB expression in the subcortical white matter of human brain tissue after TBI. (A–D) GFAP expression in white matter. (E–H) CRYAB expression in white matter. (A,B,E,F) Control tissue. (C,D,G,H) TBI tissue. (A,C,E,G) Microphotographs with objective lens 10×/0.25, scale bar: 200 μm. (B,D,F,H) Enlargement of the box shown with dashed lines, with objective lens 40×/0,75, scale bar: 50 μm.

