. 2022 Mar 14;11:e76107. doi: 10.7554/eLife.76107

Figure 1. Bifunctional enzyme properties and cryo-electron microscopy (cryo-EM) analysis of P5CS filaments.

(A) Domain organization of Drosophila melanogaster P5CS, which consists of two domains, N-terminal glutamate kinase (GK) domain and C-terminal γ-glutamyl phosphate reductase (GPR) domain. Putative mitochondrial targeting sequence (MTS) is labeled in gray; the glutamate-binding domain (GBD) and the ATP-binding domain (ABD) of the GK domain are respectively shown in orange and yellow; the NADPH-binding domain (NBD), the catalytic domain (CD), and the oligomerization domain (OD) of the GPR domain are shown in cyan, purple, and pink, respectively. Bifunctional P5CS enzyme catalytic reaction and residue numbers for domain boundaries are shown. (B–D) Single-particle analysis for 3D reconstruction of P5CS filaments, three cryo-EM maps of P5CSGlu filament, P5CSGlu/ATPγS filament, and P5CSMix filament are colored by local resolution estimations. (E) The structures of the P5CS monomer and color codes for P5CS models are indicated. (F) The P5CS dimer. Two monomers (gray or color coded by domain) interact via GPR domain hairpins contact. (G) The P5CS tetramer (sphere representation) is formed via GK domain interaction (cartoon representation) between two P5CS dimers (gray or color coded by domain). (H) The sphere and cartoon representation of P5CS filaments. P5CS filaments are modeled by the cryo-EM map. The rotated view is shown in the right panel; its rise, twist, and width are indicated.

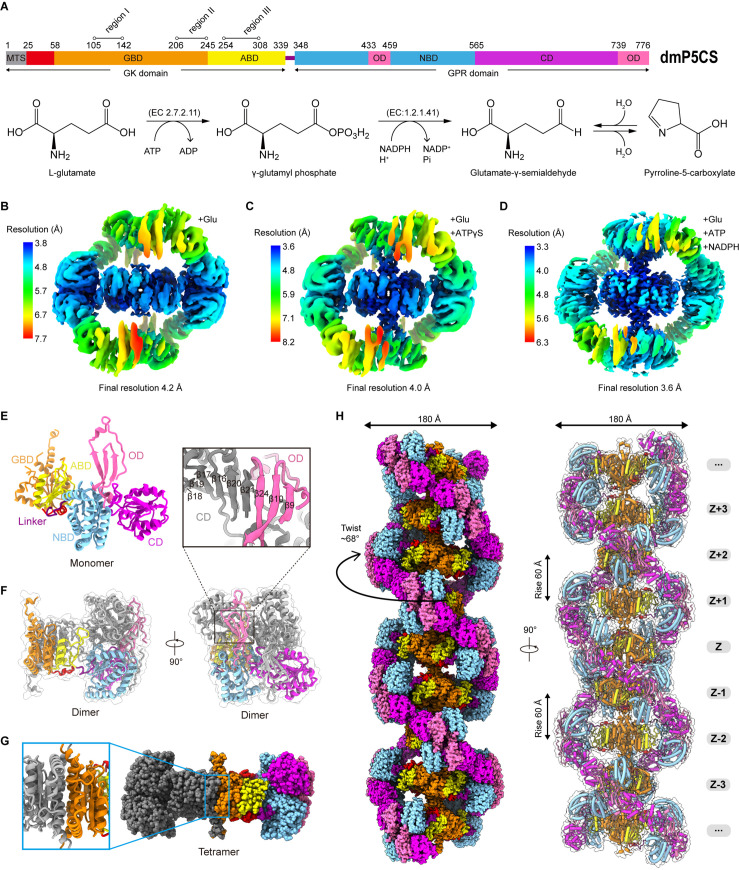
Figure 1.

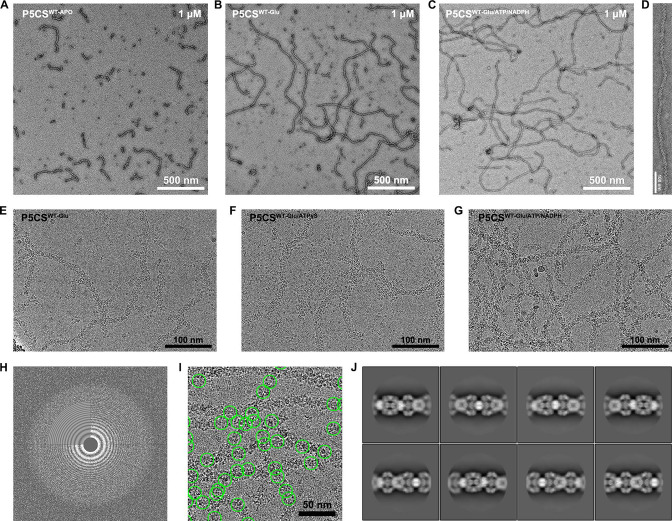
Figure 1—figure supplement 1. Substrates can significantly extend the P5CS filament.

Figure 1—figure supplement 1.

(A) Negative stain electron microscopy micrograph of P5CS protein in the APO state. P5CS protein in the APO state can self-assemble into filaments of various lengths. (B) When glutamate was added to the P5CSAPO protein, the extension of P5CS filament was observed compared to P5CSAPO filament. (C) When all substrates (MgSO4, ATP, NADPH, and glutamate) were added to induce the reaction, the long P5CSMix filaments were observed, which is similar to the P5CSGlu filaments. (D) Representative negative stain electron microscopy micrographs of a single P5CSMix filament. (E–G) Representative cryo-EM micrograph of P5CS filaments in three ligand states. (H) The power spectrum of a micrograph showing simulated contrast transfer function rings. (I) The green circles represent single particles of the picked P5CSMix filaments. (J) Representative 2D class averages of the P5CSMix filament; several classes of P5CS filament particles with less curvature were selected.
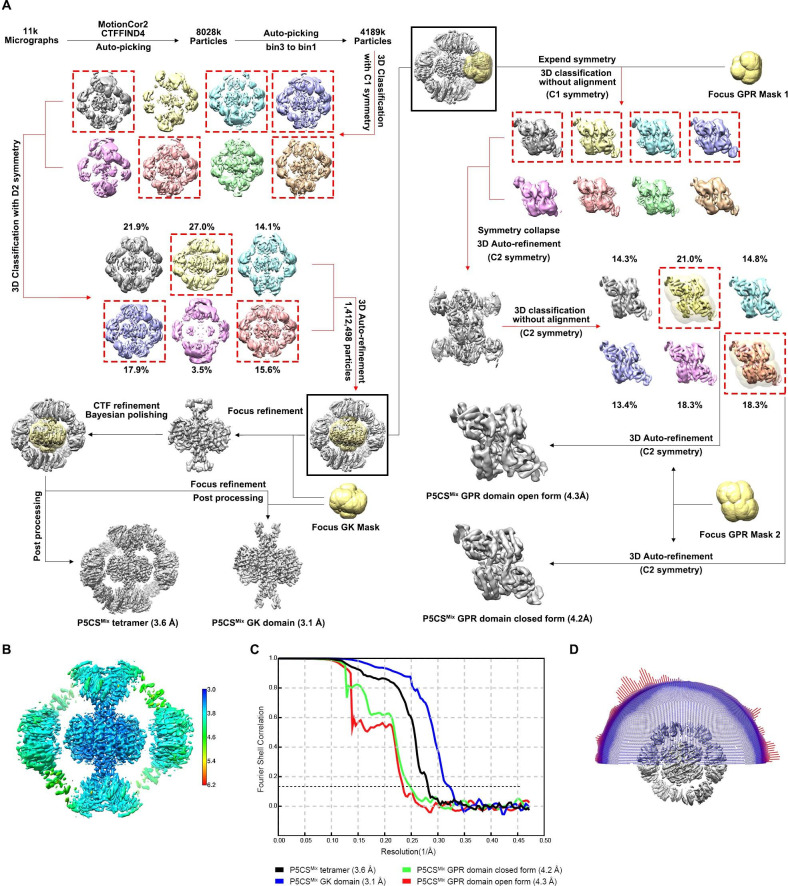
Figure 1—figure supplement 2. Cryo-electron microscopy (cryo-EM) analysis of the P5CSMix filament.

Figure 1—figure supplement 2.

(A) Flow chart for the cryo-EM reconstruction of the P5CSMix filament. The same processing scheme was used for the P5CSGlu and P5CSGlu/ATPγS filaments. Detailed procedures are described in Materials and methods. (B) Local resolution map (postprocessing) of the P5CSMix tetramer form of filament. (C) The gold-standard Fourier shell correlation (FSC) curves for four refined maps. The resolution calculated at FSC = 0.143 is indicated. (D) Angular distribution of the particles used for the final reconstruction of the P5CSMix filament.
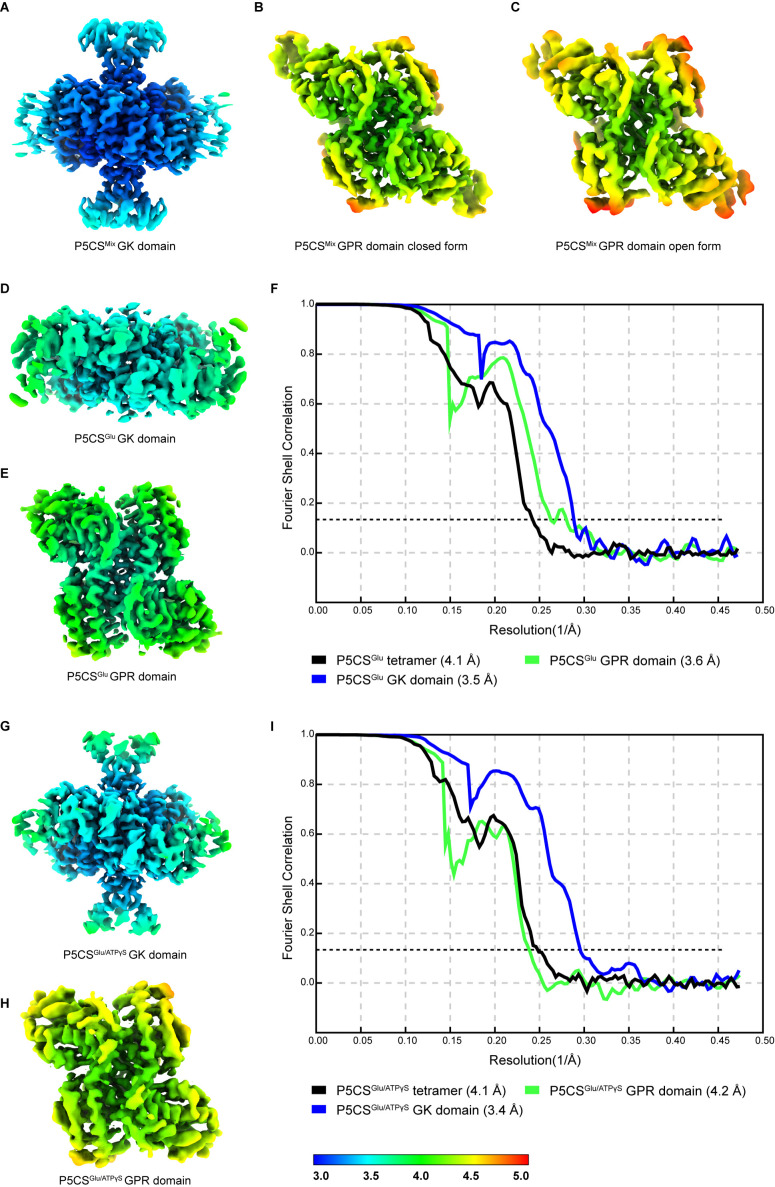
Figure 1—figure supplement 3. Quality of cryo-electron microscopy (cryo-EM) maps.

Figure 1—figure supplement 3.

(A–C) Local resolution distribution of the glutamate kinase (GK) and γ-glutamyl phosphate reductase (GPR) domains in the P5CSMix filament. The corresponding Fourier shell correlation (FSC) curve is shown in Figure 1—figure supplement 2. (D–F) Local resolution distribution of the GK and GPR domains in the P5CSGlu filament, and FSC curve for all structures. The resolution calculated at FSC = 0.143 is indicated. (G–I) Local resolution distribution of the GK and GPR domains in the P5CSGlu/ATPγS filament, and FSC curve for all structures. The resolution calculated at FSC = 0.143 is indicated.
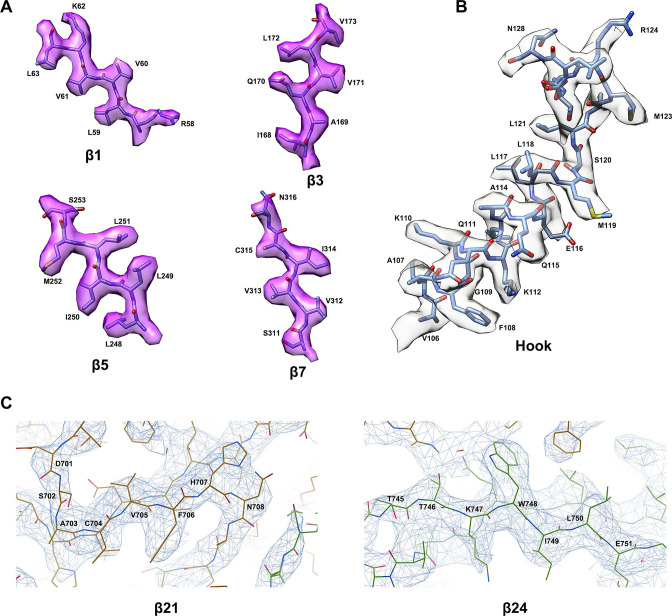
Figure 1—figure supplement 4. Representative cryo-electron microscopy (cryo-EM) map.

Figure 1—figure supplement 4.

Representative regions of the P5CS protein model superimposed by cryo-EM map. (A) Atomic model of P5CS β-strands. (B) Atomic model of the hook structure α-helices. (C) Representative cryo-EM density of β21 and β24 is displayed at 4.5 σ contour level; panel (C) was generated by Coot.
Figure 1—video 1. Morph between the consensus structures of P5CSGlu filaments.
Download video file (2.3MB, mp4)
The model was generated by fitting the tetramer into each class of the 3D classification with C1 symmetry. Protomers were colored differently. This video implies the dynamic changes of the Glu-bound state of P5CS filaments. Morphs between conformations were created in ChimeraX.
Figure 1—video 2. Morph between the consensus structures of P5CSMix filaments.
Download video file (7.4MB, mp4)
The model was generated by fitting the tetramer into each class of the 3D classification with C1 symmetry. Each protomer was colored differently. This video shows the dynamic changes of P5CSMix filaments. Morphs between conformations were created in ChimeraX. See also Figure 1—video 1.