. 2022 Mar 14;11:e76107. doi: 10.7554/eLife.76107

Figure 3. Structural comparison of the two types of glutamate kinase (GK) domain.

(A) Comparison of one protomer of the GK domain tetramer in the P5CSGlu filament (green) and P5CSMix filament (blue-violet) on the right panel. On the left panel, the dashed lines in the model represent the open loop (blue-violet) and closed loop (green) in region II. (B) Superimposition of the GK domain tetramer in the P5CSglu filament (green) with the P5CSMix filament (blue-violet). Transitions from glutamate-bound-conformation to G5P-Mg-ADP-bound conformation are shown as curved arrows, indicating GK domain conformational changes in the P5CS filament.

Figure 3.

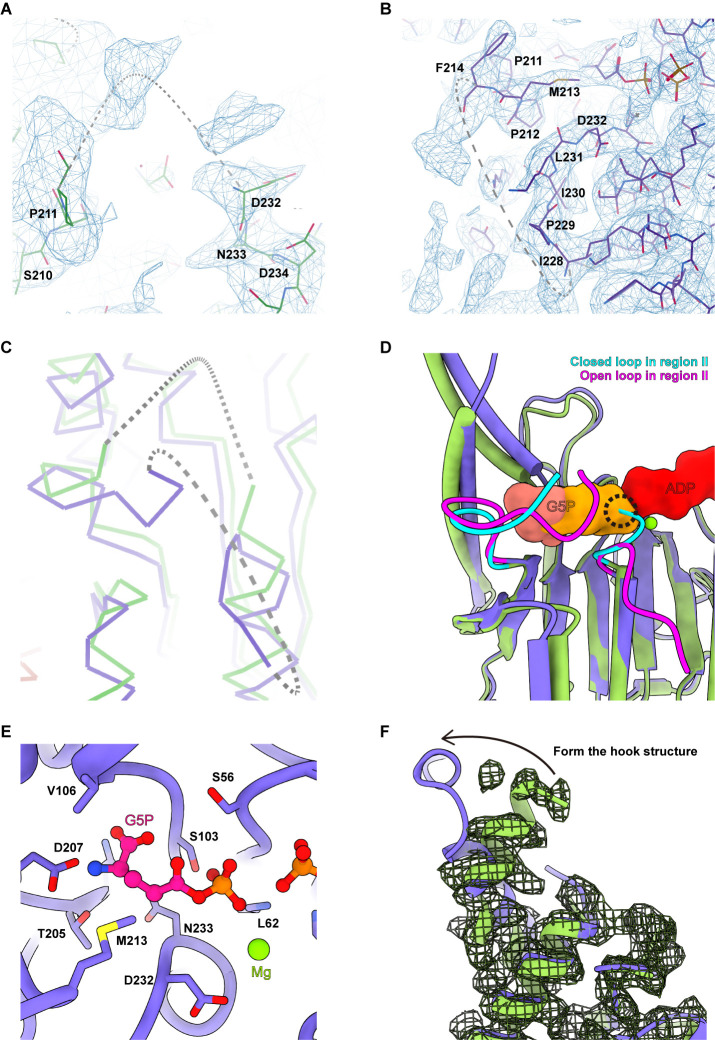
Figure 3—figure supplement 1. The conformational changes in regions I and II.

Figure 3—figure supplement 1.

(A, B) Cryo-electron microscopy (cryo-EM) map quality of region II in the P5CSGlu filament (A) and P5CSMix filament (B). (C) Dashed lines generated by Coot represent disorder segment; superimposition between the P5CSGlu filament (green) and P5CSMix filament (blue-violet) in region II indicates significant conformational differences. (D) The open loop (pink) and closed loop (cyan) are highlighted in our models, referred to panel (C). G5P (pink and yellow) and ADP (red) are shown as surface representation, the steric clash between the closed loop (cyan) and the phosphate moiety (yellow) of G5P is indicated. (E) G5P-binding site of the GK domain in the P5CSMix filament. (F) The conformational change of hook structure in region I, and cartoon models have overlaid the cryo-EM density of the P5CSGlu filament shown as mesh.