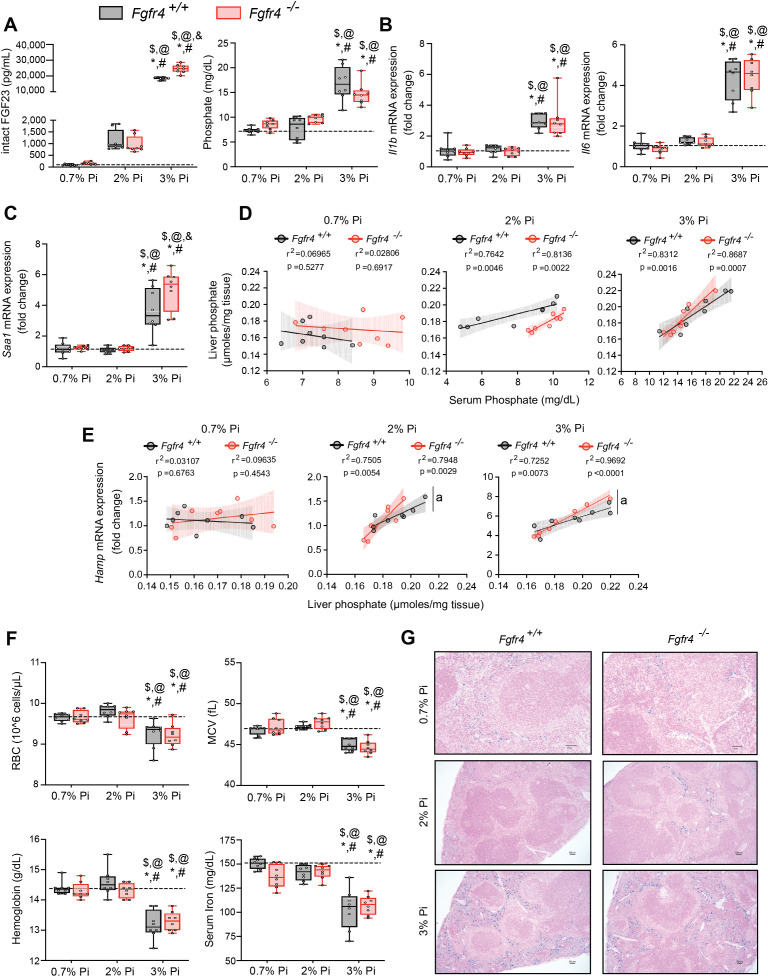
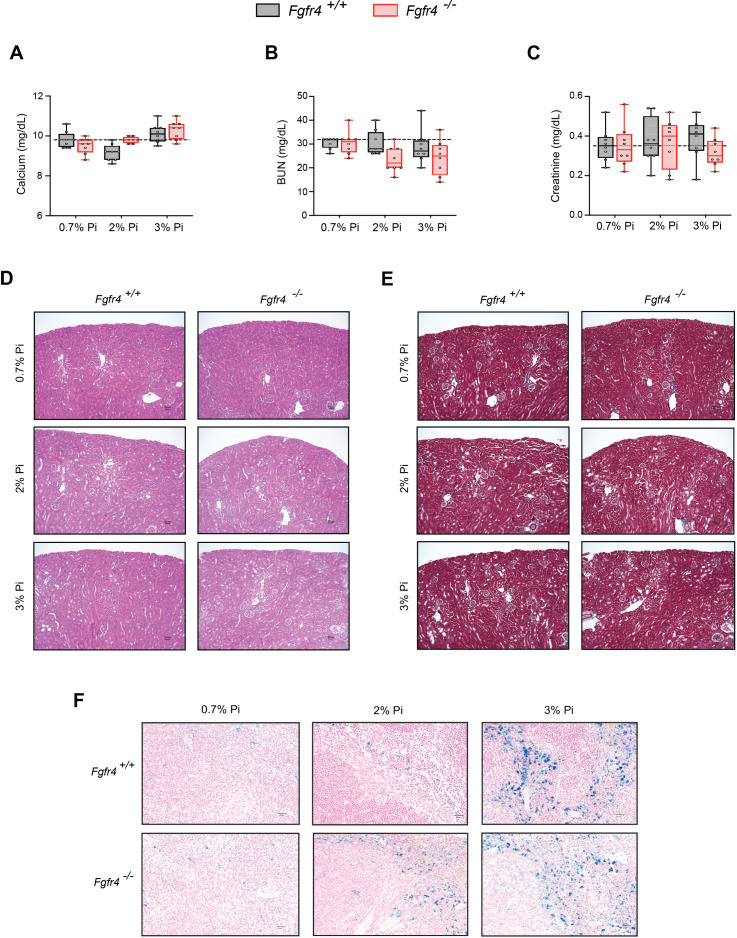
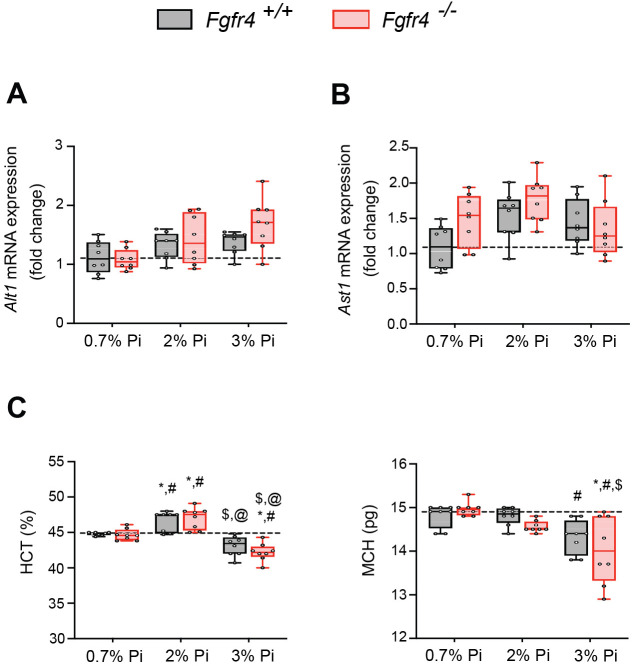
Figure 2. FGF23-FGFR4 signaling does not contribute to hypoferremia following dietary Pi overload.
(A) Serum FGF23 and serum Pi levels. (B, C) Quantitative polymerase chain reaction (qPCR) analysis of Il1b, Il6, and Saa1 expression levels in liver tissue. (D) Scatter plots showing correlations between liver Pi and serum Pi levels. (E) Scatter plots showing correlations between liver Hamp expression and liver Pi levels (a = slopes are significantly different from each other). (F) CBC analysis. (G) Representative gross pathology of Perls’ Prussian blue-stained spleen sections (scale bar, 50 μm). Larger magnification is shown in supplementary figure and legends. All values are mean ± standard error of the mean (SEM; n = 8 mice/group; *p ≤ 0.05 vs. Fgfr4+/+ + 0.7% Pi diet, #p ≤ 0.05 vs. Fgfr4−/− + 0.7% Pi diet, $p ≤ 0.05 vs. Fgfr4+/+ + 2% Pi diet, @p ≤ 0.05 vs. Fgfr4−/− + 2% Pi diet, &p ≤ 0.05 vs. Fgfr4+/+ + 3% Pi diet) where statistical analyses were calculated by two-way analysis of variance (ANOVA) followed by Tukey’s multiple comparison post hoc test. Dotted lines indicate median Fgfr4+/+ + 0.7% Pi diet measurements. Scatter plot shadows indicate 95% confidence interval.


