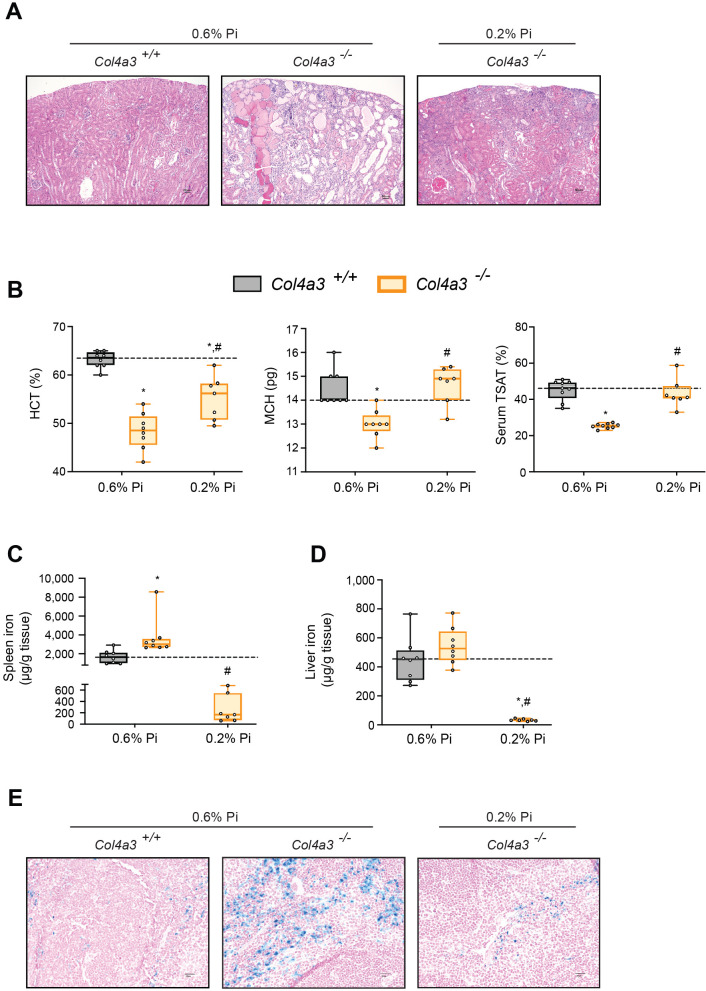
Figure 4. Low Pi feeding limits functional iron deficiency in Col4a3−/− (Alport ) mice.
BUN, serum creatinine (A), serum FGF23 and serum Pi levels (B). Quantitative polymerase chain reaction (qPCR) analysis of Il1b, Il6, and Saa1 (C, D) and Hamp (E) expression levels in liver tissue. (F) CBC analysis. (G) Representative gross pathology of Perls’ Prussian blue-stained spleen sections (scale bar, 50 μm). Larger magnification is shown in supplementary figure and legends. (H) Liver Pi levels. All values are mean ± standard error of the mean (SEM; n = 7–9 mice/group; *p ≤ 0.05 vs. Col4a3+/+ + 0.6% Pi diet, #p ≤ 0.05 vs. Col4a3−/− + 0.6% Pi diet) where statistical analyses were calculated by two-way analysis of variance (ANOVA) followed by Tukey’s multiple comparison post hoc test. Dotted lines indicate median Col4a3+/+ + 0.6% Pi diet measurements.


