. 2022 Mar 17;11:e71282. doi: 10.7554/eLife.71282

Figure 2. Fiber type-specific metabolic and structural changes in response to AdipoRon.

Chronic AdipoRon treatment in aged male C57BL/6J mice (25 months old). (A) Immunodetection of Type IIa (green) and Type IIb (red) shown at 2.5× magnification (Left), representative histochemical staining for Cytochrome C Oxidase activity (Middle), and immunohistochemistry for Type I (blue), Type IIa (green), Type IIb (red), and Type IIx (black) in adjacent gastrocnemius muscle sections at 20× magnification (Right). (B) Type IIa and Type IIx fiber counts normalized to (C) Cytochrome C Oxidase staining intensity analysis (D) and cross-sectional area of individual fibers. Data shown as mean ± SEM, significance determined by t-test (*p<0.05). (E) mRNA expression as percent of total myosin heavy chain isoforms (Control [n=10] and AdipoRon [n=8]). (F) Relative mRNA expression (relative to Rn18s RNA) of adiponectin receptors Adipor1 and Adipor2 from young (Control [n=6] and AdipoRon [n=6]) and aged (Control [n=10] and AdipoRon [n=8]) mice. Data shown as fold change of average difference from Rn18s ± SEM, significance determined by ANOVA (*p<0.05).

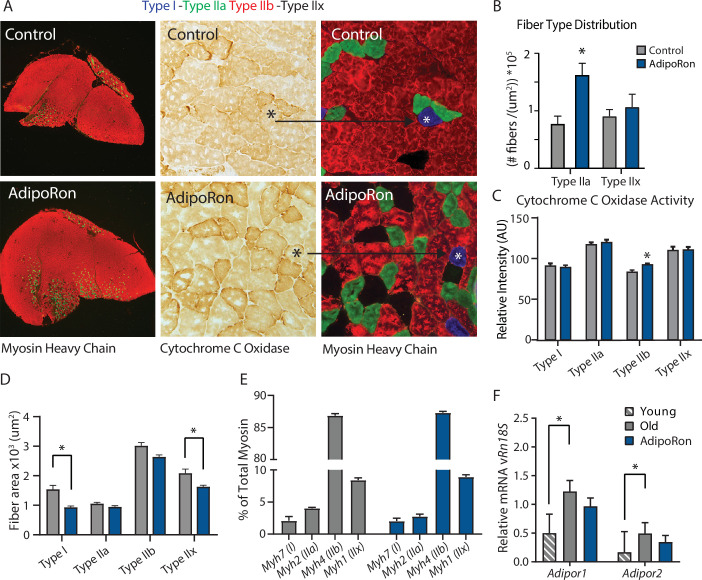
Figure 2.

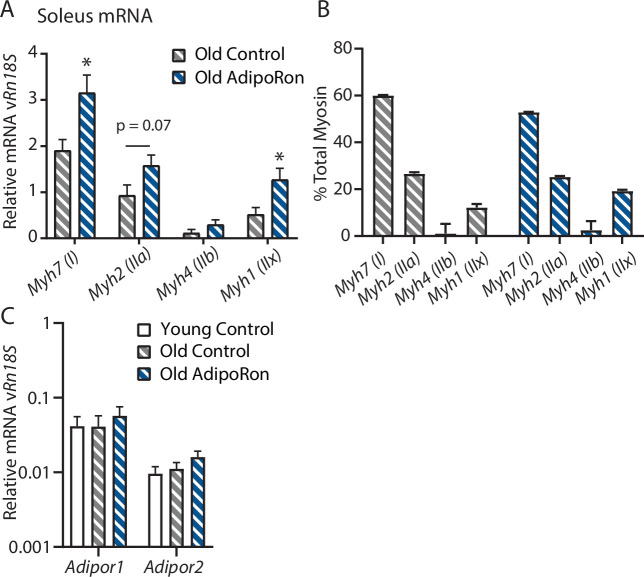
Figure 2—figure supplement 1. Chronic AdipoRon treatment in aged mice soleus.

Figure 2—figure supplement 1.

(A) Relative mRNA expression myosin heavy chain isoforms versus Rn18s ribosomal RNA, (B) isoform distribution as a percent total in soleus of AdipoRon treated mice. (C) mRNA expression of adiponectin receptors Adipor1 and Adipor2 versus Rn18s in young and aged control and AdipoRon treated mice (Control [n=6] and AdipoRon [n=6]). Data shown as fold change of average difference from Rn18s RNA reference ± SEM with significance determined by Student’s t-test or ANOVA (*p<0.05).
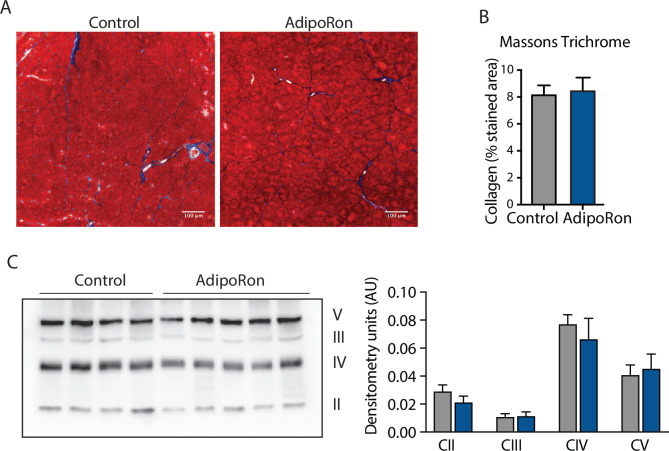
Figure 2—figure supplement 2. Effect of AdipoRon treatment on aged muscle fibrosis.

Figure 2—figure supplement 2.

Chronic AdipoRon treatment effect on muscle fibrosis shown via (A) representative Masson’s trichrome stained images from control and AdipoRon gastrocnemius, (B) quantitation of intramuscular collagen content based on n=5 images per mouse, (C) immunodetection of proteins in the electron transport system (ETS) in gastrocnemius from control and AdipoRon treated animals with immunoblot quantitation relative to ponceau total protein loading control.