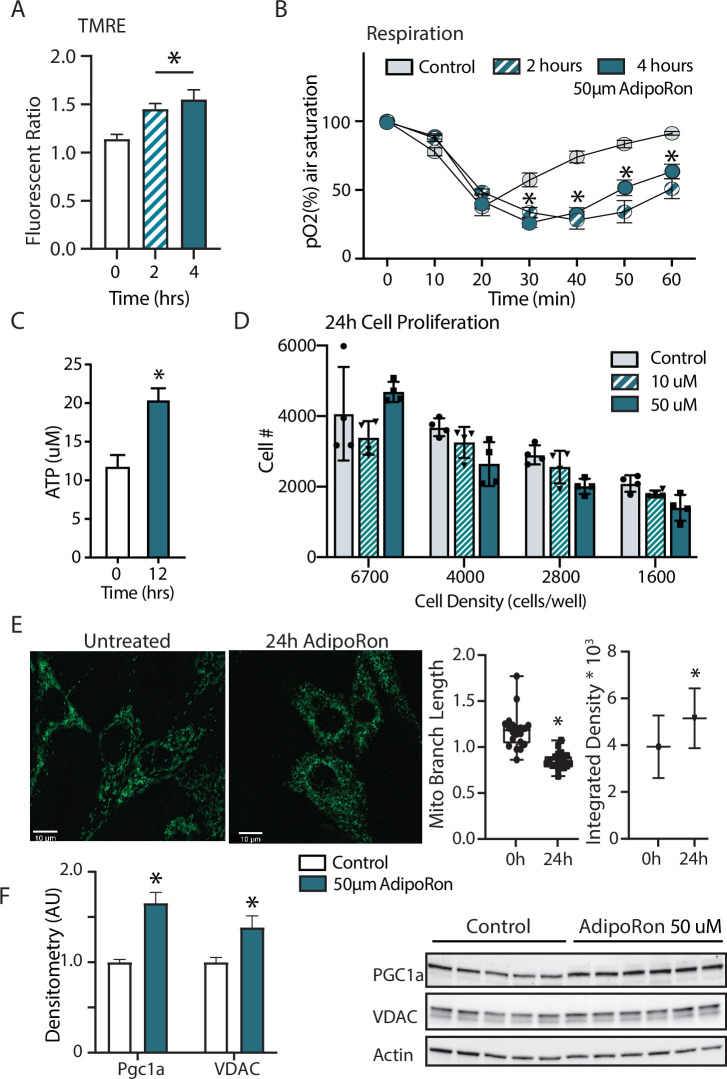
Figure 5. Short term impact of AdipoRon treatment on mitochondrial metabolism in murine fibroblasts.
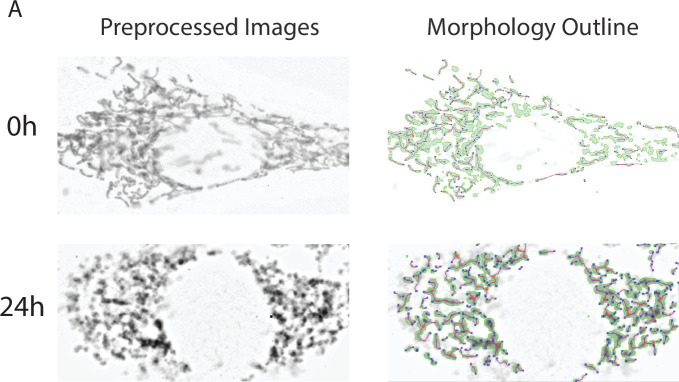
(A) Mitochondrial membrane potential measured by TMRE assay at 2 and 4 hr of AdipoRon treatment (n=6 per group), (B) oxygen consumption measured in response to AdipoRon treatment (Control-open circle, AdipoRon 2 hr-hatched circle, AdipoRon 4 hr-filled circle) by oxoplate assay (n=5 per group), (C) ATP concentration after indicated times with 50 µm AdipoRon treatment, (D) impact of 24 hr of AdipoRon treatment on cell proliferation of differing seeding densities as assessed by CyQUANT assay (n=4 per group), (E) fluorescent detection of mitochondria in fixed NIH-3T3 following AdipoRon treatment including quantitation of integrated density (product of mean intensity and mitochondrial area), and mean mitochondrial skeleton branch length (15–20 cells per time point), (F) Western blot showing protein levels of PGC1a and VDAC after 48 hr of 50 µm AdipoRon treatment of NIH-3T3 fibroblasts (n=5–6 per group), data shown as average shown as mean ± SEM (*p<0.05 via Student’s t-test).


