. 2022 Mar 14;11:e74500. doi: 10.7554/eLife.74500

Figure 3. Monkeys’ behavior under different strategies.

(A) The probabilities of the monkeys adopting the local or global strategy correlate with the number of local pellets. Solid lines denote means, and shades denote standard errors. (B) The probabilities of the monkeys adopting the local or approach strategy correlate with the distance between Pac-Man and the ghosts. Solid lines denote means, and shades denote standard errors. (C) When adopting the global strategy to reach a far-away patch of pellets, the monkeys’ actual trajectory length was close to the shortest. The column denotes the actual length, and the row denotes the optimal number. The percentages of the cases with the corresponding actual lengths are presented in each cell. High percentages in the diagonal cells indicate close to optimal behavior. (D) When adopting the global strategy to reach a far-away patch of pellets, the monkeys’ number of turns was close to the fewest possible turns. The column denotes the actual turns, and the row denotes the optimal number. The percentages of the cases with the corresponding optimal numbers are presented in each cell. High percentages in the diagonal cells indicate close to optimal behavior. (E) Average fixation ratios of ghosts, energizers, and pellets when the monkeys used different strategies. (F) The monkeys’ pupil diameter increases around the strategy transition (solid line). Such increase was absent if the strategy transition went through the vague strategy (dashed line). Shades denote standard errors. Black bar at the bottom denotes p<0.01, two-sample t-test. See Figure 3—figure supplement 1 for the analysis for individual monkeys.

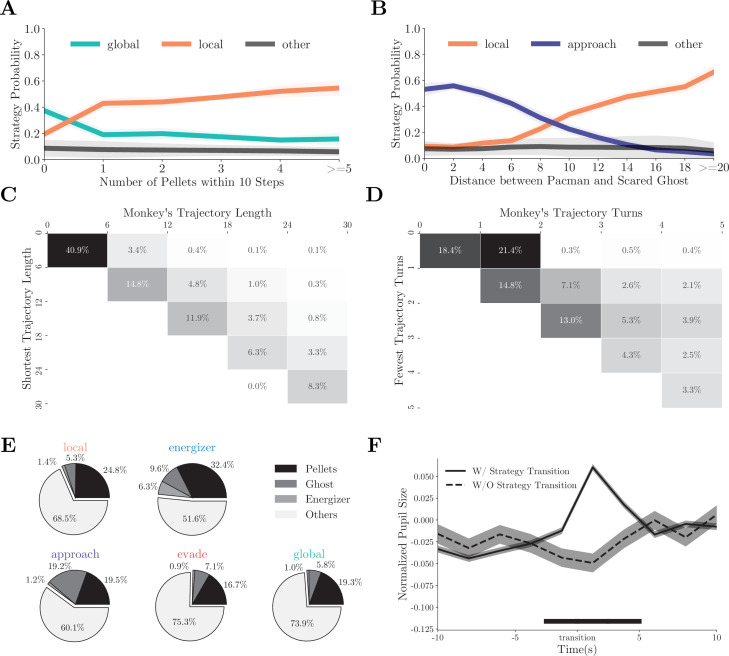
Figure 3.

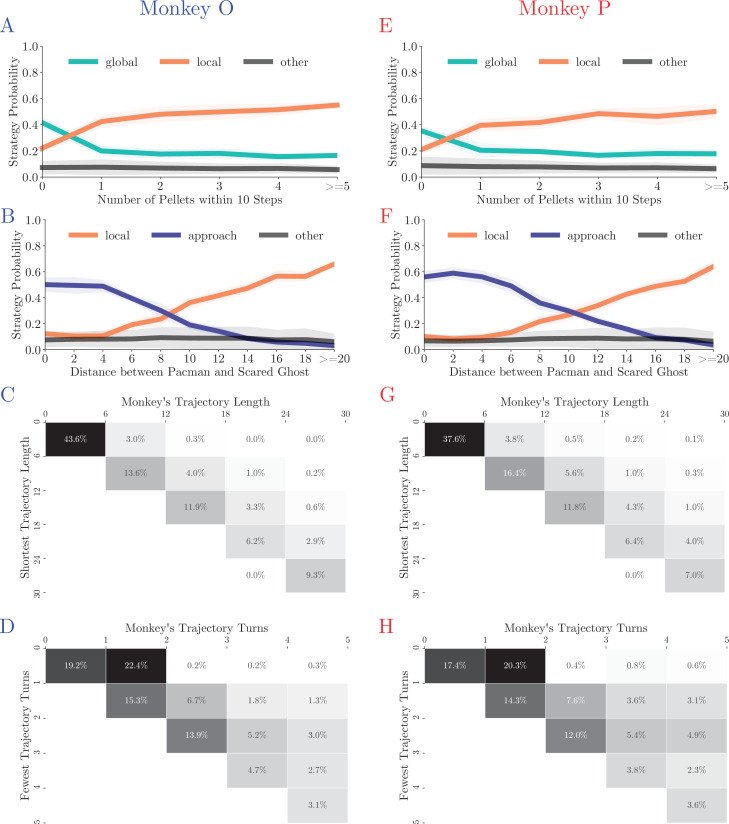
Figure 3—figure supplement 1. Monkey’s behavior under different strategies for Monkey O (left) and Monkey P (right).

Figure 3—figure supplement 1.

(A, E) The probabilities of the monkeys adopting the local or global strategy correlate with the number of local pellets. Solid lines denote means, and shades denote standard errors. (B, F) The probabilities of the monkeys adopting the local or approach strategy correlate with the distance between Pac-Man and the ghosts. Solid lines denote means, and shades denote standard errors. (C, G) When adopting the global strategy to reach a far-away patch of pellets, the monkeys’ actual trajectory length was close to the shortest. The column denotes the actual length, and the row denotes the optimal number. The percentages of the cases with the corresponding actual lengths are presented in each cell. High percentages in the diagonal cells indicate close to optimal behavior. (D, H) When adopting the global strategy to reach a far-away patch of pellets, the monkeys’ number of turns was close to the fewest possible turns. The column denotes the actual turns, and the row denotes the optimal number. The percentages of the cases with the corresponding optimal numbers are presented in each cell. High percentages in the diagonal cells indicate close to optimal behavior.
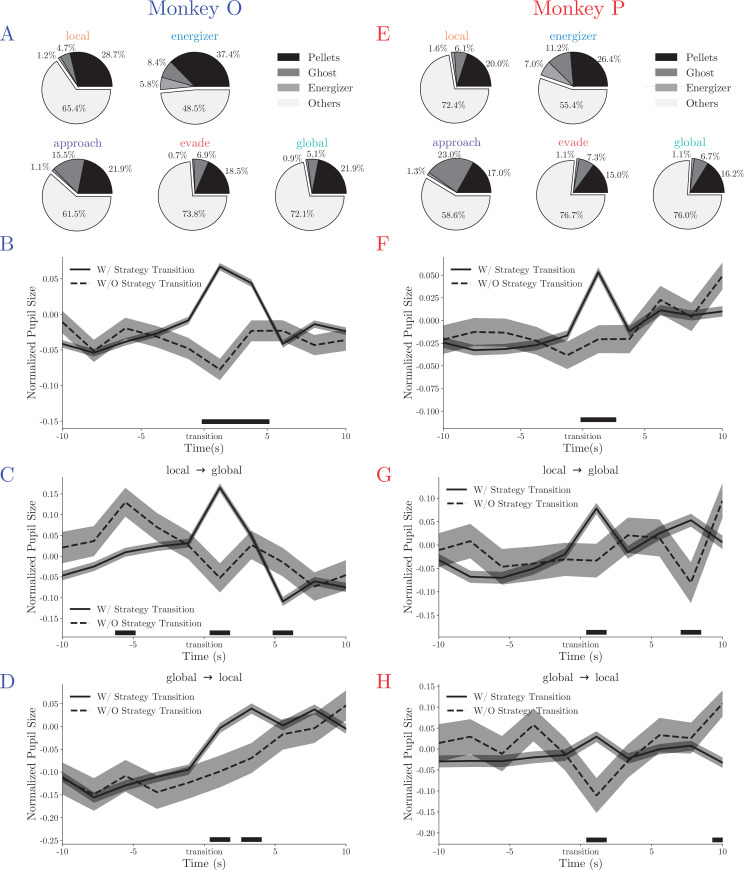
Figure 3—figure supplement 2. Monkey’s eye movement patterns under different strategies for Monkey O (left) and Monkey P (right).

Figure 3—figure supplement 2.

(A, E) Average fixation ratios of ghosts, energizers, and pellets when the monkeys used different strategies. (B, F) The monkeys’ pupil diameter increases around the strategy transition (solid line). Such increase was absent if the strategy transition went through the vague strategy (dashed line). Shades denote standard errors across trials. Black bars at the bottom denote p<0.01, two-sample t-test. (C, G) The monkeys’ pupil diameter increase was evident in transitions from local to global. Shades denote standard errors across trials. Black bars at the bottom denote p<0.01, two-sample t-test. (D, H) The monkeys’ pupil diameter increase was evident in transitions from global to local in Monkey P. It was not obvious in Monkey O as the pupil size increased in general. Shades denote standard errors across trials. Black bars at the bottom denote p<0.01, two-sample t-test.