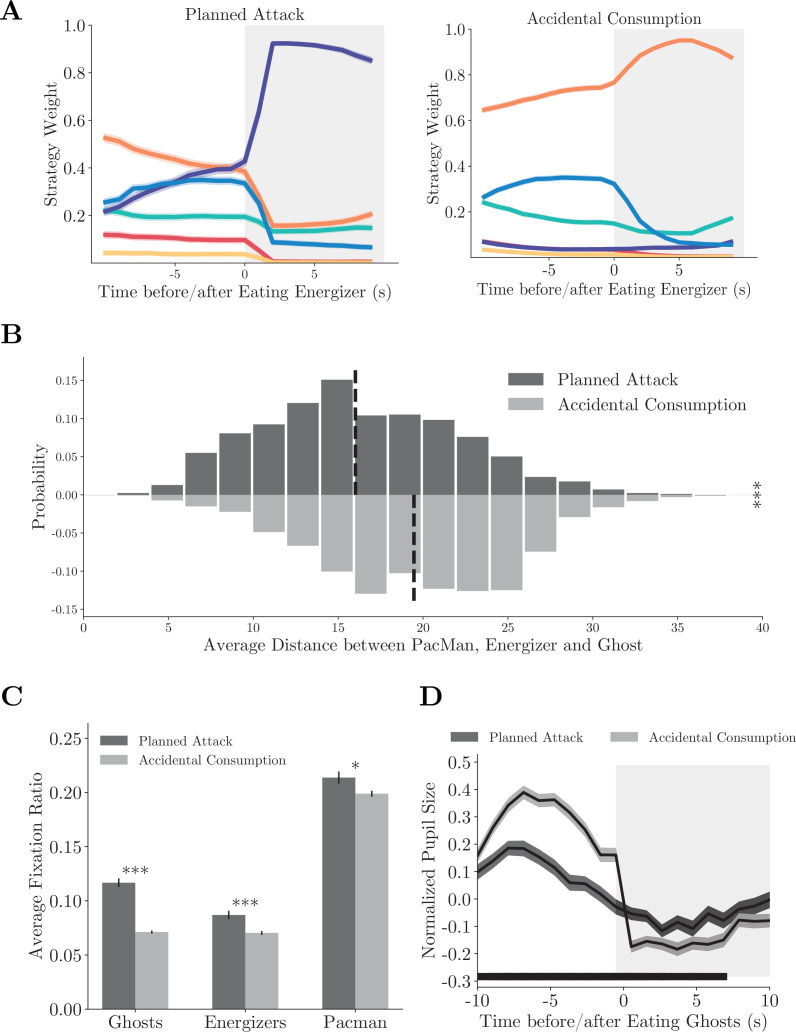
Figure 5. Compound strategies: planned attack.
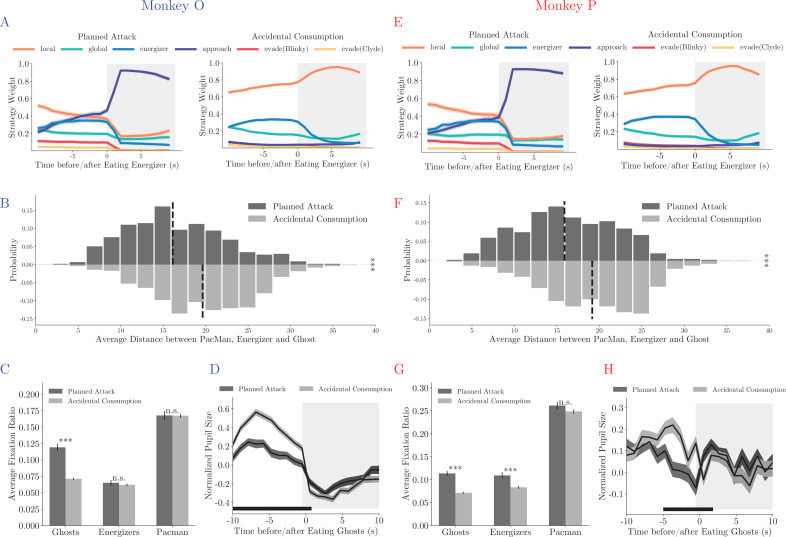
(A) Average strategy weight dynamics in planned attacks (left) and accidental consumptions (right). Solid lines denote means, and shades denote standard errors. (B) The average distance between Pac-Man, the energizer, and the ghosts in planned attacks and accidental consumptions. Vertical dashed lines denote means. ***p<0.001, two-sample t-test. (C) Ratios of fixations on the ghosts, the energizer, and Pac-Man. Vertical bars denote standard errors. ***p<0.001, **p<0.01, two-sample t-test. (D) The pupil size aligned to the ghost consumption. The black bar near the abscissa denotes data points where the two traces are significantly different (p<0.01, two-sample t-test). Shades denote standard errors at every time point. See Figure 5—figure supplement 1 for the analysis for individual monkeys.


