
Figure 5.
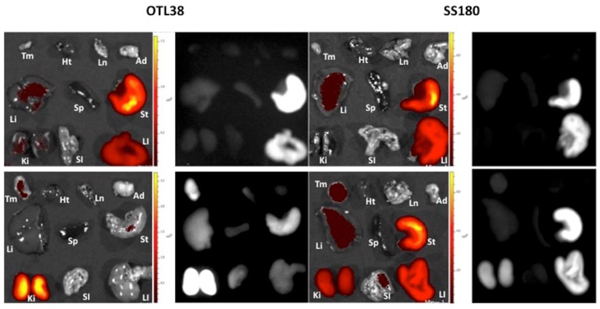
Biodistribution and systemic toxicity studies of mice after injection with 100 μL of 10 μM OTL38 or SS180. Top Row, Dye-Naïve Mice; Bottom Row, Treatment Mice. Tm = Tumor, Ht = Heart, Ln = Lung, Ad = Adipose, Li = Liver, Sp = Spleen, St = Stomach, Ki = Kidney, SI = Small Intestine, LI = Large Intestine. Dye-Naïve Mice were imaged at OTL38 and SS180 IVIS parameters for complete comparison.