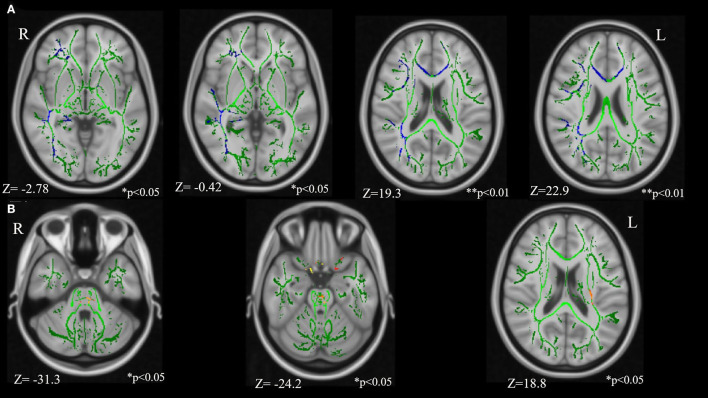
Figure 2.
Results of the tract-based spatial statistics revealed significant differences between the TSC and control groups in fractional anisotropy (FA). (A) Axial slices of mean FA skeleton (green) represent areas of no significant difference between groups. Regions in blue indicate areas where the value of FA is significantly lower in the TSC group (TSC < Control); right IFOF**, right SLF**, genu of CC*, right UF*, and right ILF*. (B) Regions in yellow/orange/red indicate areas where the value of FA is significantly higher in the TSC group (TSC > Control); pontine crossing tract*, bilateral CST*. FWE corrected, p < 0.05, with a cluster size of voxels > 10. Results are adjusted for age and sex. **p < 0.001, *p < 0.05. IFOF, inferior frontal occipital fasciculus; SLF, superior longitudinal fasciculus; ILF, inferior longitudinal fasciculus; UF, uncinate fasciculus; CST, corticospinal tract; FWE, family wise error.

