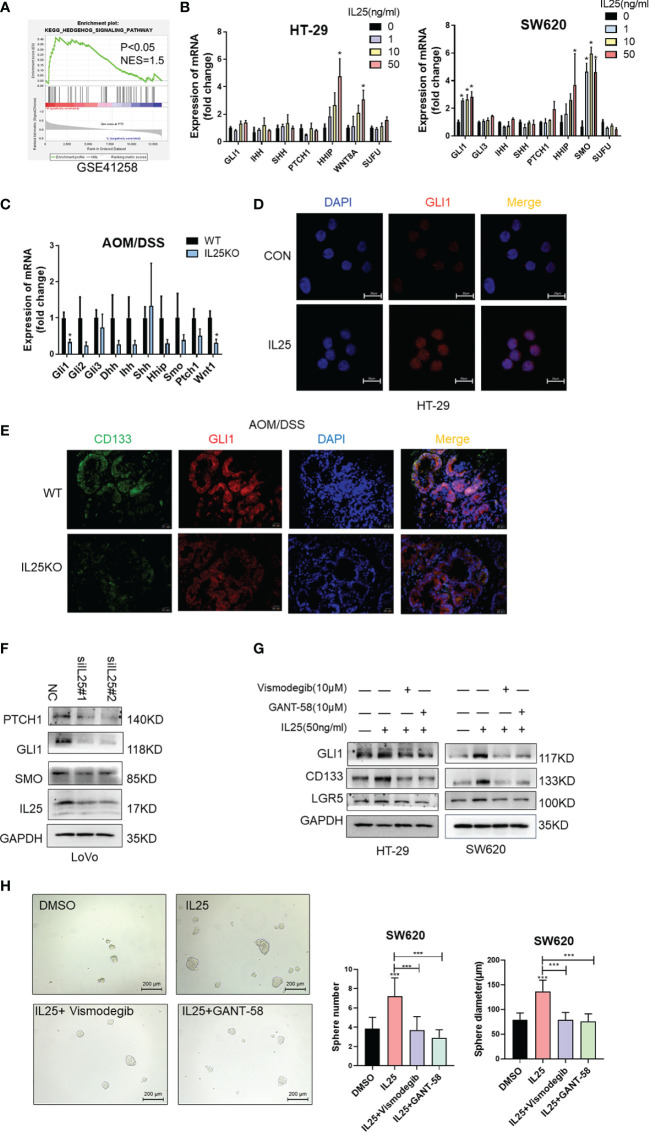
Figure 5.
IL25 promoted stemness via the Hedgehog signaling pathway in CRC cancer. (A) GSEA for Hedgehog signaling pathway (nominal p < 0.05) in IL25 high expression colorectal cancer compared with IL25 low expression colorectal cancer from GSE41258. (B) The expression levels of Hedgehog signaling genes were examined in HT-29 and SW620 cells treated with recombinant IL25 in a concentration-dependent manner by RT-PCR. (C) The expression levels of Hedgehog signaling genes were examined in WT and IL25KO AOM/DSS-induced CRC cancer tissues by RT-PCR. (D) GLI1 expression was detected by immunofluorescence staining in HT-29 cells treated with or without 50 ng/ml IL25. (E) GLI1 and CD133 expression were detected by multiplexed fluorescence staining in the WT and IL25KO AOM/DSS-induced tumor tissues. Representative images show the expression of GLI1 (red), DAPI (blue), and CD133 (green). (F) Western blotting of Hedgehog signaling genes in LoVo cells following IL25 silencing. (G) Western blotting of GLI1 and CD133 in HT-29 and SW620 cells treated with SMO inhibitor Vismodegib and GLI1 inhibitor GANT-58 following IL25 treatment. (H) Sphere formation analysis of SW620 cells treated with SMO inhibitor Vismodegib and GLI1 inhibitor GANT-58 following IL25 treatment. Representative images (left) and the mean numbers and sphere size (right) of spheres are shown. Data present as mean ± SEM; *p < 0.05, ***p < 0.001.

