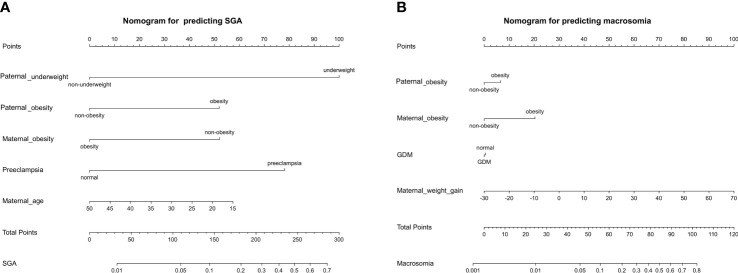
Figure 3.
The nomogram was developed to predict the incidence rate of SGA (A) and macrosomia (B) based on the significant predictors in the multivariable analysis. Draw an upward vertical line from each variable axis to obtain the point of each variable. Calculate the sum of each variable score and draw an upward vertical line from the total score axis to obtain the predicted incidence of SGA or macrosomia.

