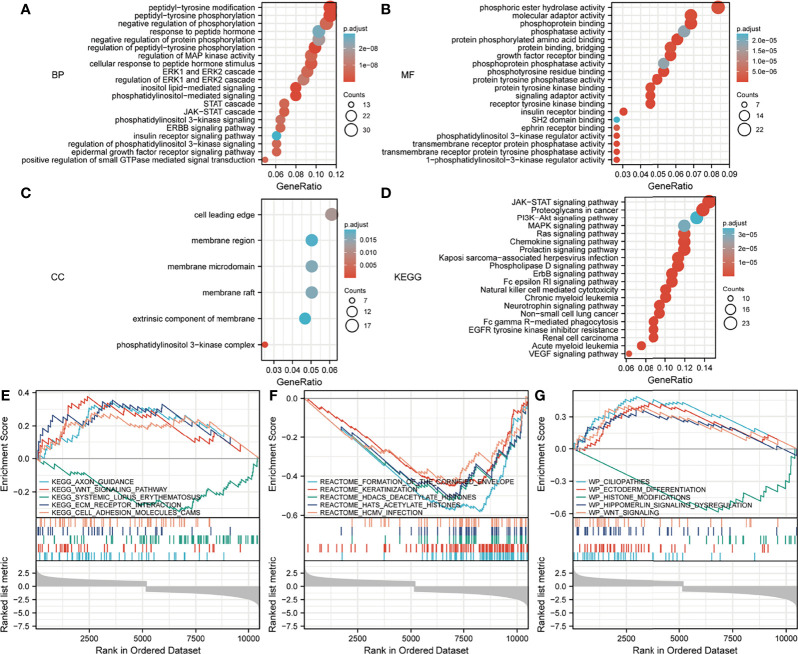
Figure 11.
Analysis of the EPOR gene enrichment in pan-cancer. (A) Top 20 terms in BPs from GO enrichment analysis. (B) Top 20 terms in MFs from GO enrichment analysis. (C) Top 20 terms in CCs from GO enrichment analysis. (D) KEGG enrichment analysis showed the top 20 KEGG pathways. (E) Top 5 KEGG pathways from GSEA. (F) Top 5 reactome pathways from GSEA. (G) Top 5 wiki pathways from GSEA.

