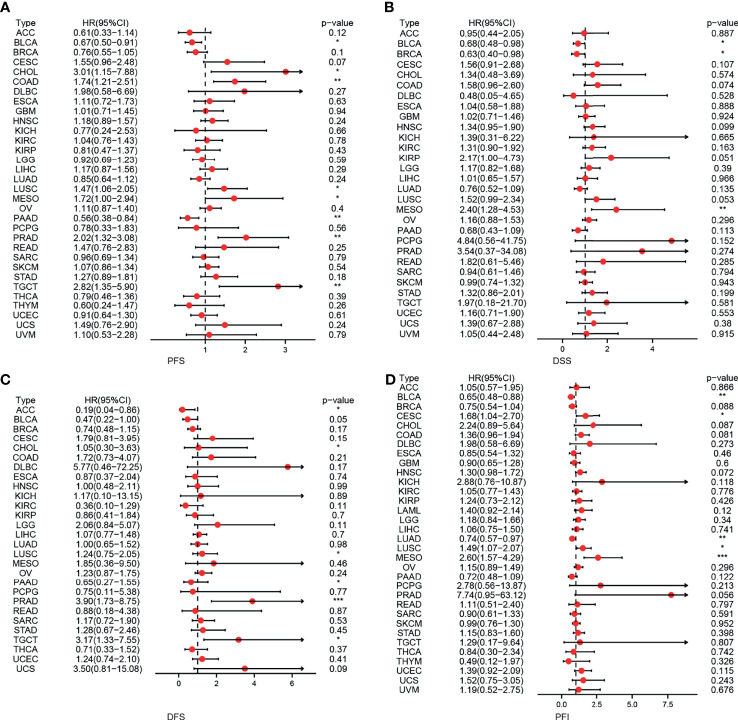
Figure 3.
The correlation between EPOR expression and prognosis for PFS, DSS, DFS, and PFI in pan-cancer. (A) The correlation between EPOR expression and PFS in different cancer types of TCGA. (B) The correlation between EPOR expression and DSS in different cancer types of TCGA. (C) The correlation between EPOR expression and DFS in different cancer types of TCGA. (D) The correlation between EPOR expression and PFI in different cancer types of TCGA. The red part represents the risk ratio. *p < 0.05, **p < 0.01, ***p < 0.001.

