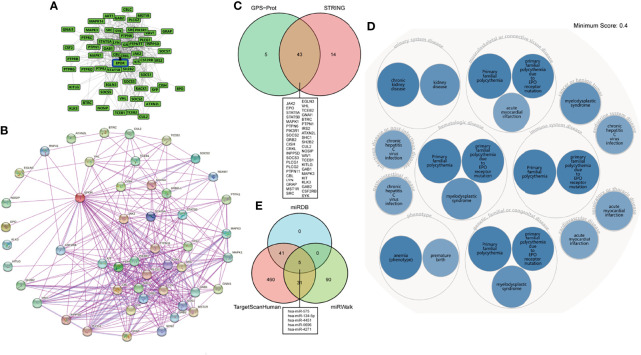
Figure 5.
(A) EPOR-interacting proteins network analysis in the GPS-Prot online server. (B) EPOR-interacting proteins network analysis in the STRING database. (C) Venn diagram showed the intersection of EPOR-interacting proteins from GPS-Prot and STRING. (D) The OPENTARGET platform was used to conduct a gene–disease network analysis of EPOR. (E) Venn diagram showed miRNAs associated with EPOR genes from miRDB, TargetScanHuman, and miRWalk databases.

