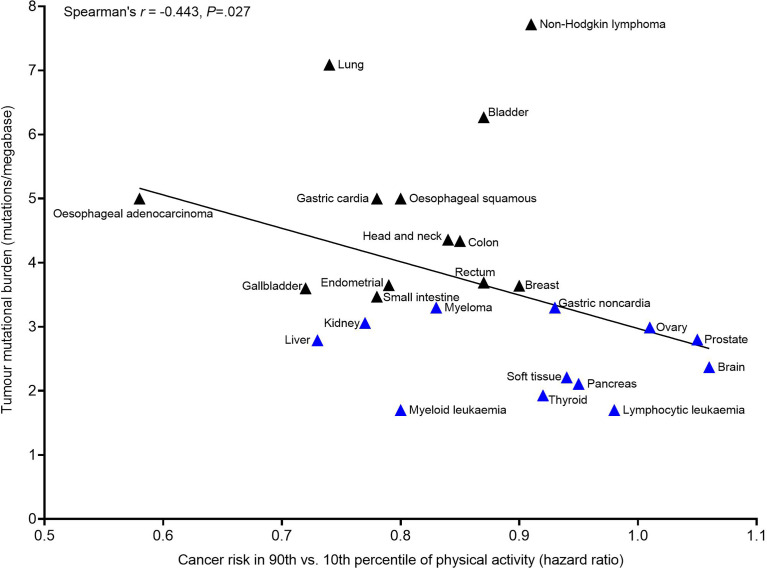
Figure 1.
Association between the tumour mutational burden (TMB) of a cancer tissue location and the magnitude of risk reduction for that cancer site in the 90th vs. 10th percentile of self-report leisure-time physical activity. Cancer risk in the 90th vs. 10th percentile of physical activity data were obtained from ref (2). TMB data were obtained from ref (77). Blue triangles indicate cancer sites with a TMB below the median (<3.47 mutations per megabase) and black triangles indicate cancer sites with a TMB equal to or above the median (≥3.47 mutations per megabase). Associations between TMB and cancer risk in 90th vs. 10th percentile of physical activity were examined using Spearman’s r as data were not normally distributed (Shapiro-Wilk P>.05). Analysis was performed in Graph Pad Prizm v9.0.1 (GraphPad Software, California, USA). Melanoma was excluded from analysis due to established confounding effects of UV exposure on cancer risk associated with physical activity. TMB data from ref (77) included multiple different cancer subtypes within a given tissue location. The TMB of relevant cancer subtypes was calculated for each of the cancers reported in ref (2), guided by the International Classification of Diseases for Oncology 3rd Edition, as per Supplemental Table 3 in ref (2). This calculation was adjusted to control for the frequency of samples (per cancer subtype) analysed in ref (77), in an attempt to adjust for the relative incidence of different cancer subtypes among the general population. Nevertheless, a limitation of this approach remains an assumption that different cancer subtypes – which commonly varied in TMB – were equally represented in the sampling of ref (2) and ref (77).

