Figure 6.
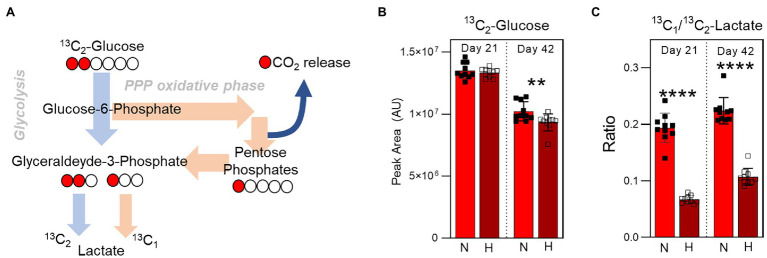
Isotope tracing analysis to disentangle glycolysis vs. pentose phosphate pathway utilization. (A) The labeling scheme of 13C1,2-Glucose is shown, which depicts the relative contribution of 13C2-lactate and 13C1-lactate to the total lactate pool by glycolysis and the pentose phosphate pathway, respectively. (B) The relative levels (in peak area, arbitrary units) of 13C2-Glucose at Day 21 (left) and Day 42 (right) in RBC stored under normoxic (light red) or hypoxic (dark red) conditions. (C) The ratio of 13C1-lactate to 13C2-lactate in the same samples. p-values from a two-tailed paired T-test comparing normoxic and hypoxic storage at each time point are indicated as **p < 0.01; and ****p < 0.0001.

