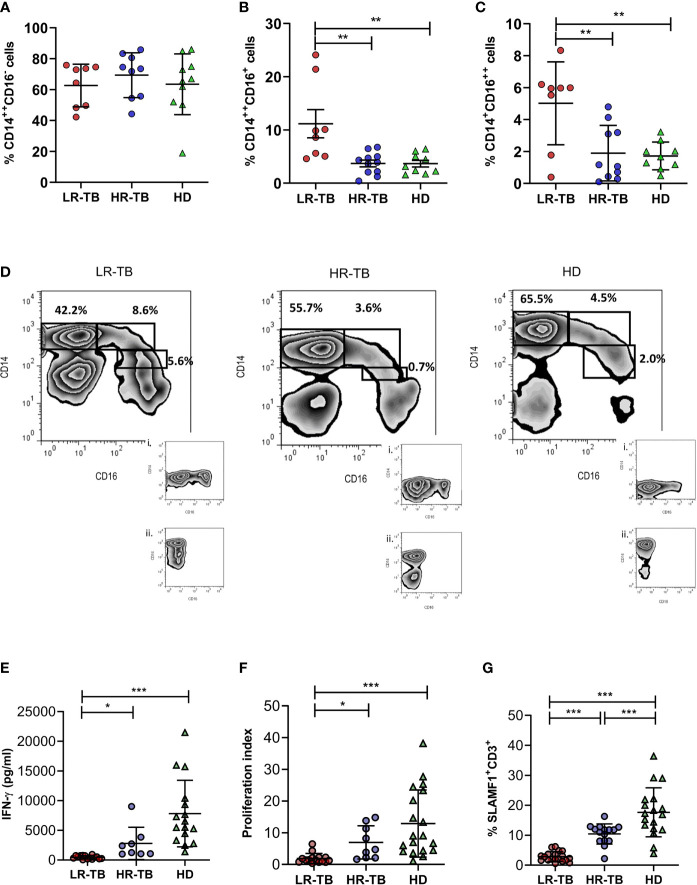
Figure 1.
Monocyte profile and immunological classification parameters of TB patients. Monocyte subpopulation frequencies in peripheral blood mononuclear cell fraction from low responder TB patients (LR-TB), high responder TB patients (HR-TB) and healthy donors (HD) were determined by flow cytometry. Percentages of CD14++CD16- (A), CD14++CD16+ (B) and CD14+CD16++ (C) monocytes are shown. Mean of percentages of cells ± SD for each group of subjects are shown (LR-TB N = 8, HR-TB N = 11 and HD N = 10). P values were calculated by one-way ANOVA and Tukey´s multiple comparison post-test for unpaired samples. **P < 0.01. Each symbol represents an individual. A representative density plot and isotype controls i) for CD14 FICT and ii) for CD16 APC of each group of individuals is shown (D). (E) IFN-γ levels measured by ELISA in supernatants of fresh PBMC stimulated for 48h with Mtb-Ag (10 µg/ml). (F) Proliferation index evaluated by [3H]-thymidine incorporation. (Proliferation index = c.p.m. after 5 days of Mtb-Ag-stimulation/c.p.m. after unstimulation). (G) Increase in % of SLAMF1+ T cells. Fresh PBMC were stimulated with Mtb-Ag (10 µg/ml) for 5 days. Afterwards, the expression of SLAMF1+ on CD3+ lymphocytes were determined by flow cytometry. Mean of the percentage of cells ± SD for each group is shown. *P < 0.05, **P < 0.01, ***P < 0.001. Each symbol represents an individual. For (E–G) LR-TB N = 19, HR-TB N = 15 and HD N = 19. P values were calculated by one-way ANOVA and Tukey´s multiple comparison post-test for unpaired samples.

