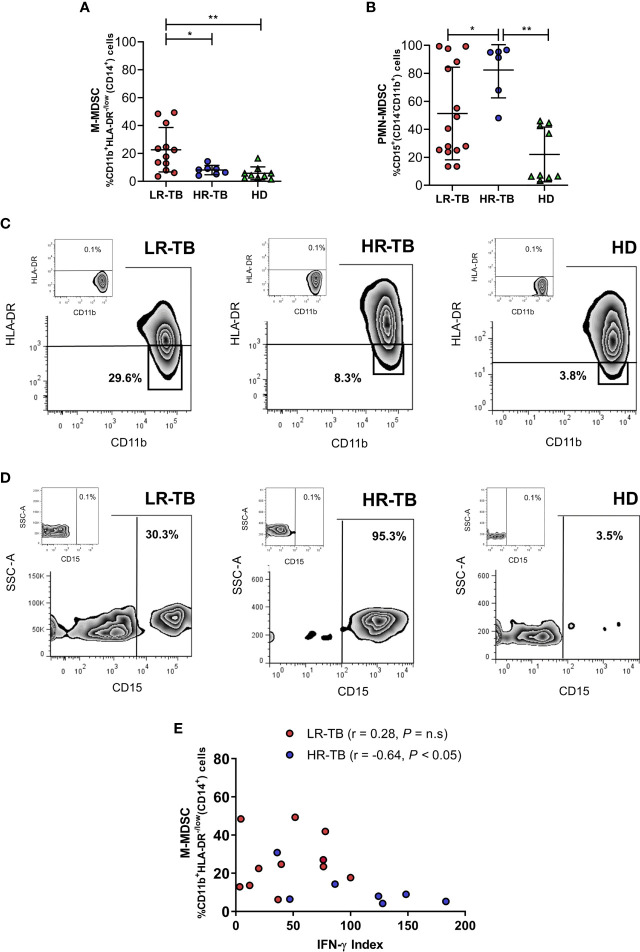
Figure 2.
Myeloid derived suppressor cells in patients with active tuberculosis. The frequencies of (A) M-MDSC [%CD11b+HLA-DR-/low(CD14+)] cells and (B) PMN-MDSC [%CD15+ (CD14-CD11b+)] cells were determined by flow cytometry in PBMC from LR-TB, HR-TB and HD. Mean of the percentage of cells ± SD for each group is shown. *P < 0.05, **P < 0.01. For (A) LR-TB N = 12, HR-TB N = 7 and HD = 9 and (B) LR-TB N = 15, HR-TB N = 6 and HD N = 9. Each symbol represents an individual. A representative density plot for M-MDSC (C) and PMN-MDSC (D) of each group of individuals is shown. (E) Correlations between the IFN-γ index and percentages of circulating M-MSDC in LR-TB and HR-TB patients. Fresh PBMC from TB patients were stimulated with Mtb-Ag (10 µg/ml) for 48 h Afterwards, the production of IFN-γ was determined in supernatants by ELISA and the IFN-γ index was calculated as described. Correlation factor (r) and P values were calculated using the Spearman correlation test (LR-TB N = 12 and HR-TB N = 7). *P < 0.05.

