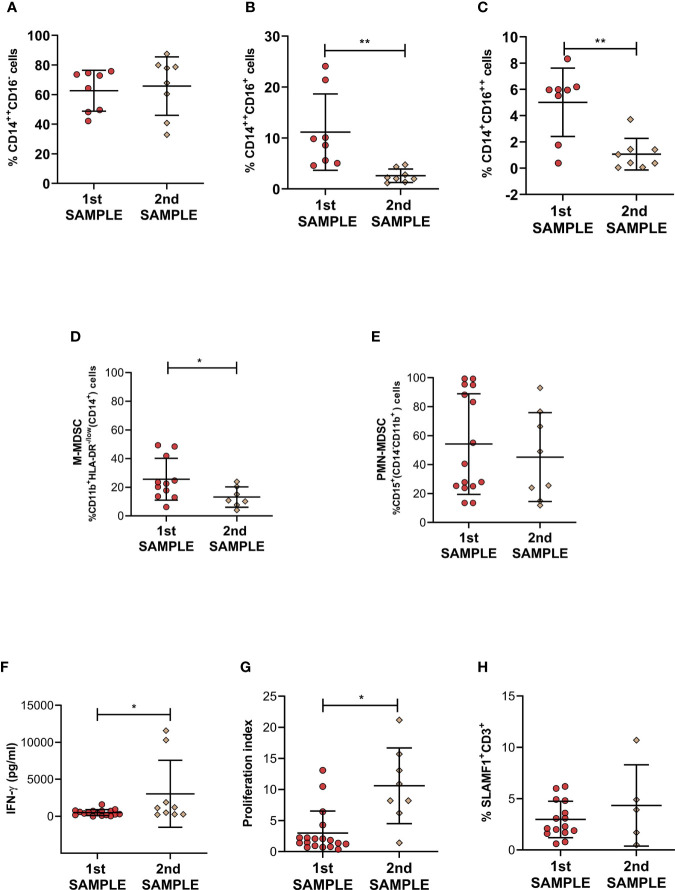
Figure 3.
Monocytes and Myeloid derived suppressor cells in active LR-TB patients undergoing anti-TB treatment. The frequencies of (A) CD14++CD16-, (B) CD14++CD16+, (C) CD14+CD16++ monocytes, (D) M-MDSC [%CD11b+HLA-DR-/low(CD14+)] and (E) PMN-MDSC [%CD15+(CD14-CD11b+)] were determined by flow cytometry in fresh PBMC from LR- TB patients at the beginning of regular anti-TB treatment (blood samples taken during the first week of chemotherapy - first sample) and after 14 - 21 days (second sample). (F) IFN-γ levels measured by ELISA in supernatants of PBMC obtained as first or second sample and stimulated for 48h with Mtb-Ag (10 µg/ml). (G) Proliferation index evaluated by [3H]-thymidine incorporation. (H) SLAMF1 on CD3+ lymphocytes were determined by flow cytometry in fresh PBMC obtained as first or second sample. For (A–C): 1st sample N=8 and 2nd sample N=8, for (D): 1st sample N=12 and 2nd sample N=7, for (E): 1st sample N=15 and 2nd sample N=8, for (F): 1st sample N=18 and 2nd sample N=9, for (G): 1st sample N=15 and 2nd sample N=5 and for (H): 1st sample N=15 and 2nd sample N=5. P values were calculated by Mann-Whitney U test for unpaired samples. Each symbol represents an individual. Mean values ± SD are shown. *P < 0.05, **P < 0.01.

