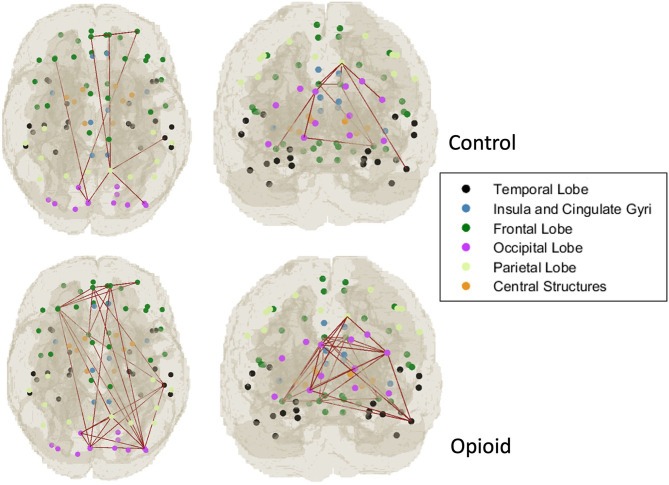
Figure 2.
Graph network modeling representation. Representative example of single subject graph network modeling for CAP C6 network in a control infant (top row) and infant with POE (bottom row). The dots refer to the center of the atlas region of interest and the connecting lines represent the thresholded graph network connections in these subjects.

