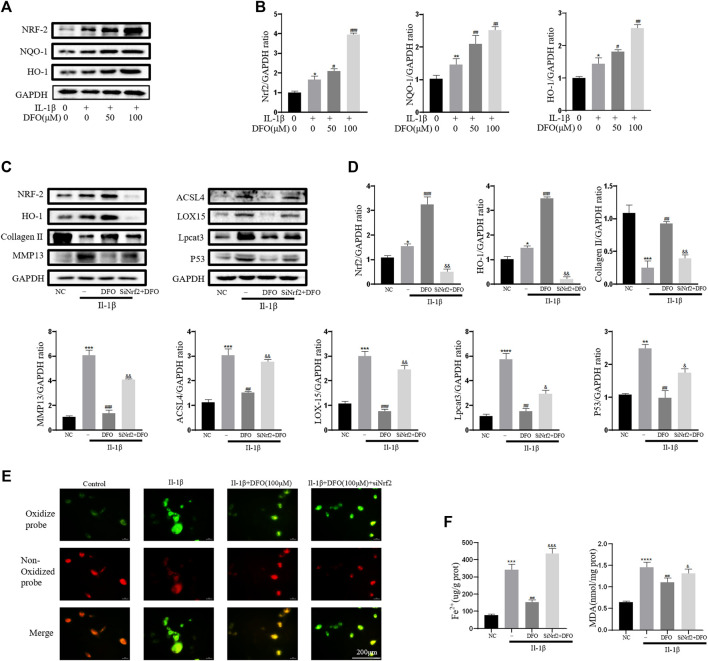
FIGURE 6.
Nrf2 signaling mediated protective effects of DFO on OA chondrocyte. (A,B) The protein expression levels of Nrf2, HO-1, and NQO-1 when treated by IL-1β (10 ng/ml) with 50 and 100 μM DFO or equal volume of DMSO were detected by Western blot, and band density ratios of Nrf2, HO-1, and NQO-1 to GAPDH in the Western blots were quantified by densitometry (n = 3). (C,D) The protein levels of Nrf2, HO-1, collagen Ⅱ, MMP13, ACSL4, LOX15, lpcat3, and P53 when treated by IL-1β (10 ng/ml) with si-Nrf2 or negative control were detected by Western blot, and band density ratios of Nrf2, HO-1, collagen Ⅱ, MMP13, ACSL4, LOX15, lpcat3, and P53 to GAPDH in the Western blots were quantified by densitometry (n = 3). (E) Intracellular lipid-ROS level detected by C11 BODIPY fluorescent probe (scale bar: 200 µm). Red, reduced form of C11-BODIPY; green, oxidized form of C11-BODIPY. (F) The intracellular level of MDA and Fe2+ was determined using the MDA assay kit and iron assay kit (n = 3). *p < 0.05 versus control, **p < 0.01 versus control, ***p < 0.001 versus control, ****p < 0.0001 versus control, #p < 0.05 versus IL-1β–treated group, ##p < 0.01 versus IL-1β–treated group, ###p < 0.001 versus IL-1β–treated group, &p < 0.05 versus IL-1β+DFO group, &&p < 0.01 versus IL-1β+DFO group, &&&p < 0.001 versus IL-1β+DFO group, and &&&&p < 0.0001 versus IL-1β+DFO group. Error bars represent SD.

