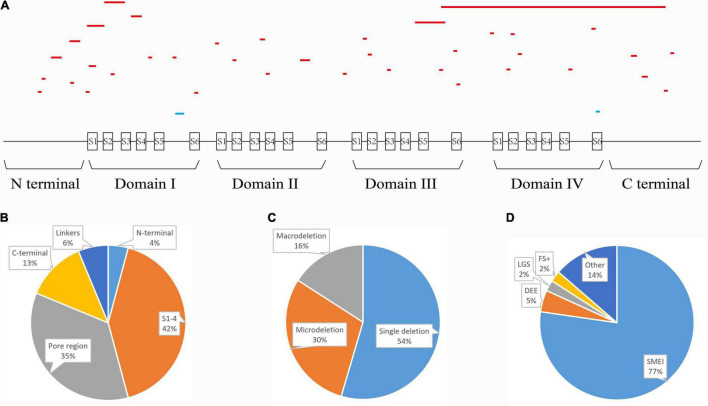
FIGURE 2.
Statistics of all in-frame deletions in SCN1A. (A) Schematic picture showing the length, location, and phenotypes of the 44 variants. Lines indicate different variants. Severe phenotypes (SMEI, DEE, and LGS) were highlighted as red, while mild phenotypes (PEFS+ and FS+) were blue. (B) Distribution of the variants on different functional domains. (C) The proportions of single deletion, microdeletions, and macrodeletions. (D) Phenotypic spectrum.

