Figure 5.
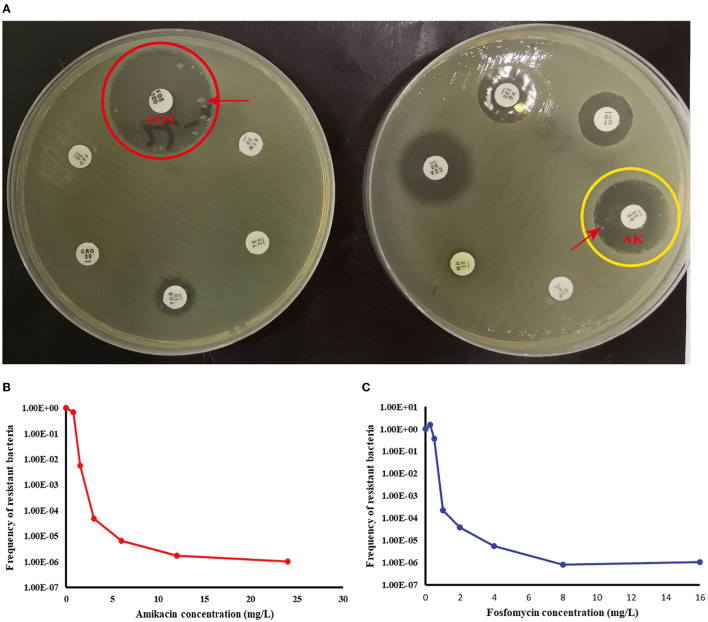
Children #22 strain (E. coli) showed FOS- and AK-co-heteroresistance. (A) K-B tests: the heteroresistance phenotypes of the strain to the two drugs. (B) The PAP curve of amikacin. (C) The PAP curve of fosfomycin. Each value was the average of the results of three repeated experiments. The highest drug concentrations on the plates (FOS and AK) were 4 times the MIC for each drug, and the heteroresistant frequencies of both drugs were >1 × 10⁻⁷. Red arrows indicated heteroresistant colonies.

