Figure 5.
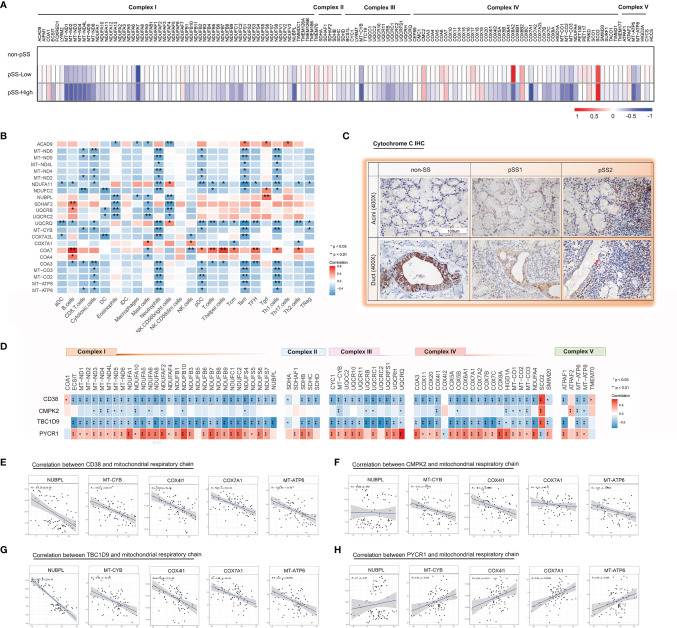
Impaired mitochondrial respiratory chain complexes in the salivary glands from pSS. (A) A heatmap shows significant down regulation in the bulk respiratory chain complex (I–V) genes in pSS from the validation cohort, particularly those encoded in the mitochondria in pSS-high-infiltration group. (B) Heatmap of the Spearman correlation values between respiratory chain complex (I–V) genes and immune responses in pSS from the validation cohort. (C) Immunohistochemical staining for cytochrome c of paraffin-embedded labial salivary gland specimens from our own cohort. Scale bar = 100 μm. (D) Heatmap of the Spearman correlation values between respiratory chain complex (I–V) genes and 4 hub genes (CD38, CMPK2, TBC1D9, and PYCR1) in pSS from the validation cohort. (E–H) Scatter plot depicted the correlation between interested respiratory chain complex genes (MT-CYB, MT-ATP6, COX7A1, NUBPL, COX4I1, CYCS) and CD38 (E), CMPK2 (F), TBC1D9 (G), and PYCR1 (H) based on the data from Figure 6D , respectively.

