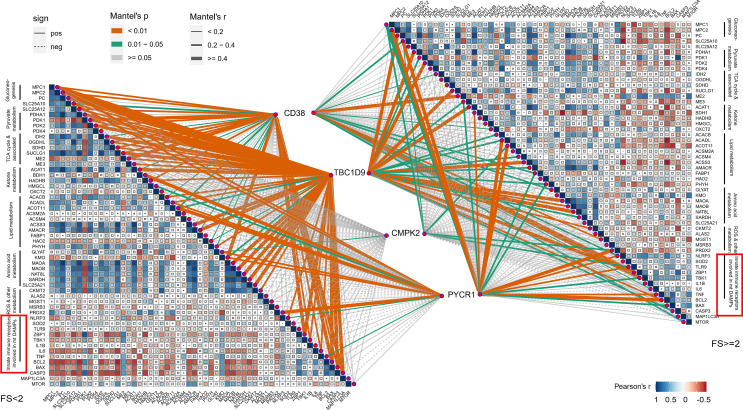
Figure 7.
Correlations between 4 hub genes and mitochondrial metabolism, damage-associated molecular patterns (DAMPs). Color represents Pearson’s correlation coefficient r of each hub genes (CD38, CMPK2, TBC1D9, and PYCR1) versus mitochondrial metabolism-related genes and DAMP gene expression, with blue color indicating a positive correlation (Pearson’s r < 0), red color indicating a negative correlation (Pearson’s r > 0). Statistical analysis was done with the Mantel test, with yellow line indicating p value <0.01, green line indicating 0.01 < p < 0.05.

