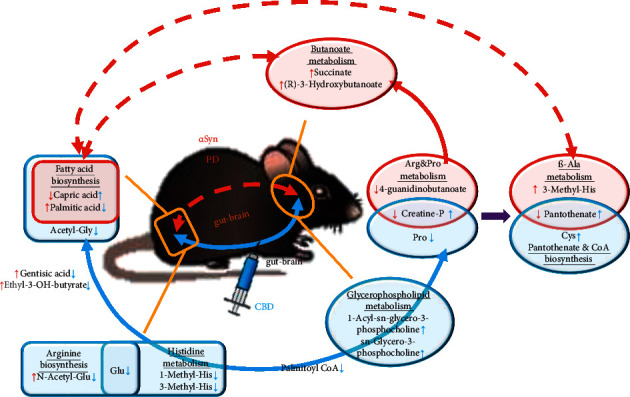
Figure 4.

Schematic for focused DEMs and corresponding functionality and pathways. Bold DEMs were highly correlated in a common regulation profile within a certain DEMs set. Red parts stand for PD pathogenesis, and blue parts stand for variation triggered by CBD.
