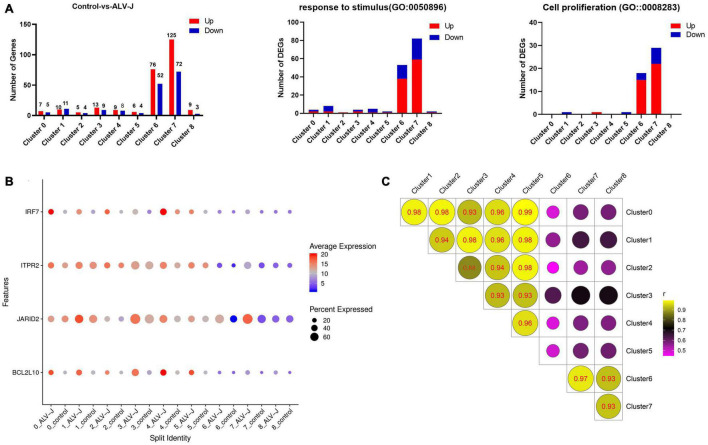
FIGURE 3.
Differentially expressed gene (DEG) analysis in PBMCs from ALV-J infected and control chickens within cell populations. (A) Bar graphs showing all up-regulated (red) and down-regulated (blue) DEGs, and the number of DEGs involved in the GO terms “response to stimulus” and “cell proliferation” in PBMCs from ALV-J infected chicken compared to control PBMCs within each cluster. (B) Dot plot representing selected DEGs (IRF7, ITPR2, JARID2, and BCL2L10) expressed in eight clusters within which cells from the ALV-J infected sample were compared with the control sample. The intensity represents the expression level, while dot size represents the proportion of cells expressing each gene. (C) Pearson’s Correlation analysis of different cell populations based on gene expression levels.

