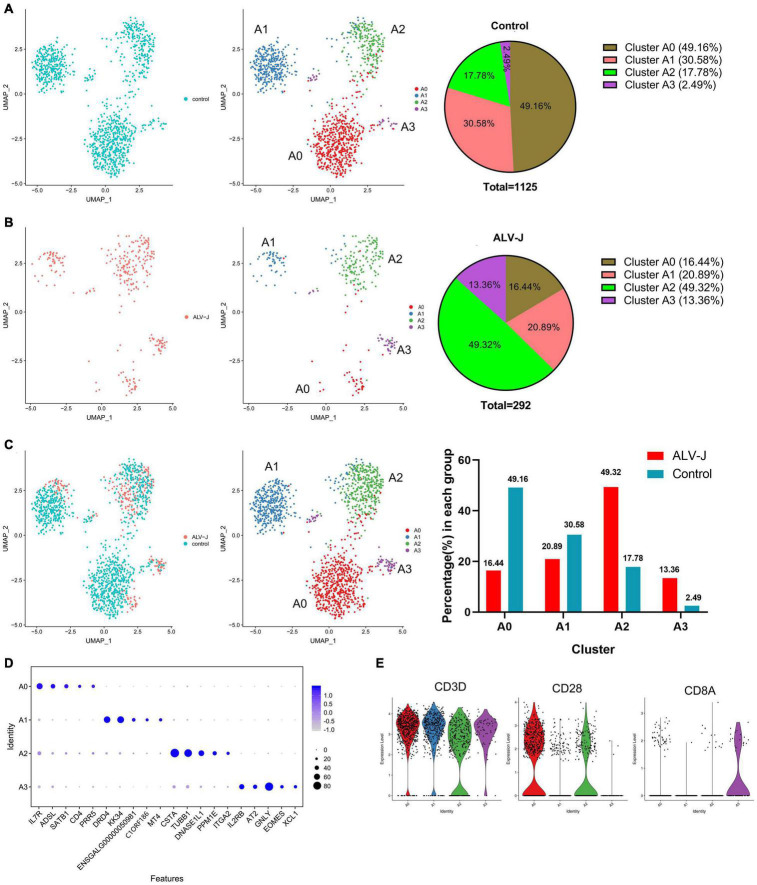
FIGURE 4.
T cell population of clusters 6 and 7 were further divided into four distinct cell populations. (A) UMAP display of the cell populations and their proportions of the T cell sub clustering (clusters 6 and 7) in the control PBMCs. (B) UMAP display of the cell populations and their proportions of the T cell sub clustering (clusters 6 and 7) in PBMCs from ALV-J infected chicken. (C) The regrouped T cell distribution and proportion of each cluster in PBMCs from ALV-J infected and control chickens. (D) Top five DEGs (x-axis) identified in clusters A0–A3 (y-axis). (E) Expression levels of characteristic marker genes (CD3D, CD28, and CD8A) in clusters A0–A3.

