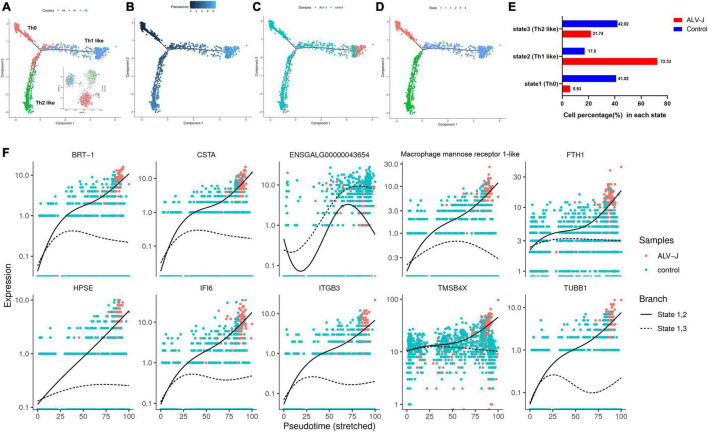
FIGURE 5.
Pseudotime analysis of clusters A0, A1, and A2. (A) Mapping of clusters A0 (Th0), A1 (Th2-like), and A2 (Thl-like) to the pseudotime trajectory. (B) Pseudotime trajectory calculated from all cells of clusters A0–A2 in the control and ALV-J infected samples. Darker colored dots represent a shorter pseudotime and earlier differentiation period. (C) Mapping of cells in control and ALV-J infected samples to the pseudotime trajectory. (D) The cell states of pseudotime trajectory partitioned from all cells of clusters A0–A2 in the control and ALV-J infected samples. (E) Cell proportion of each state between the ALV-J infected and control samples. (F) Dynamics of the top 10 branching DEGs. Full line: state 1, 2; imaginary line: state 1, 3.

