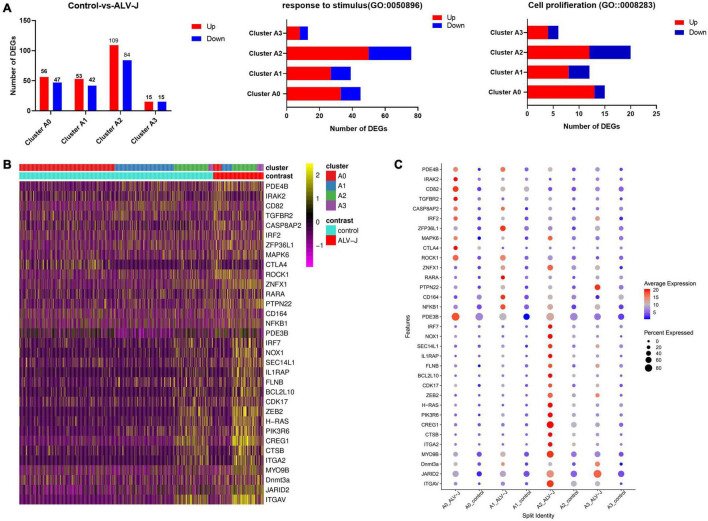
FIGURE 6.
Landscape of immune-related gene expression in clusters A0–A3 of the ALV-J infected and control samples. (A) Histogram shows all the up-regulated (red) and down-regulated (green) DEGs, and the number of DEGs involved in GO terms “response to stimulus” and “cell proliferation” in cells of clusters A0–A3 from ALV-J infected chicken compared to those from the control. (B) Heatmap shows the normalized expression (Z-score) of all immune-related DEGs in cells of clusters A0–A3 from the ALV-J infected sample compared with the control one. (C) Dot plot representing DEGs expressed in clusters A0–A3 from the ALV-J infected sample is compared with those from the control sample. The intensity represents the expression level, while the size of the dots represents the proportion of cells expressing each gene.

