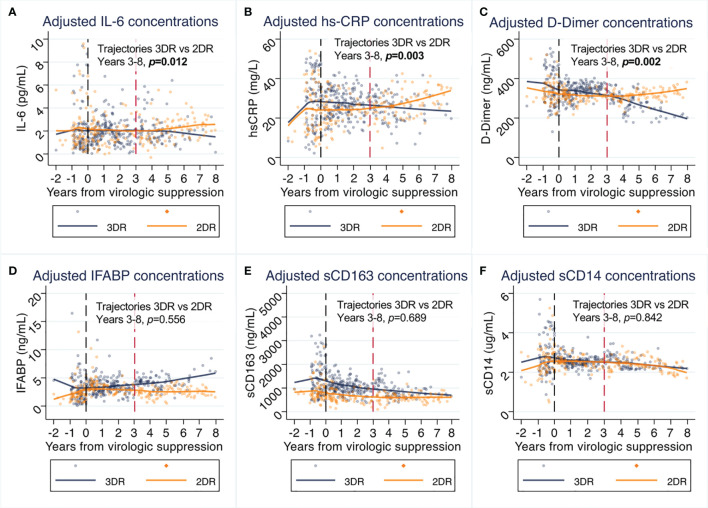
Figure 2.
(A–F) Effects of switch to 2-drug regimens (2DR) on inflammatory biomarkers compared to remaining on 3-drug regimens (3DR). Panels represent the values predicted in piecewise linear mixed models at intervals between years 0-1, 1-2, 2-3, 3-4 and 4-8, adjusted for age, sex, country of origin, mode of transmission, educational level, maximum HIV RNA, previous AIDS, nadir CD4, and pre-ART biomarker value. Lines represent predicted mean values and dots the individual observations. The P values shown in represent the between-group comparison of biomarker trajectories from year 3 to 8. The tables piecewise comparisons for the periods 0-3 and 3-8, are provided in Table 2. 3DR, 3-drug regimens; 2DR, 2-drug regimens.

