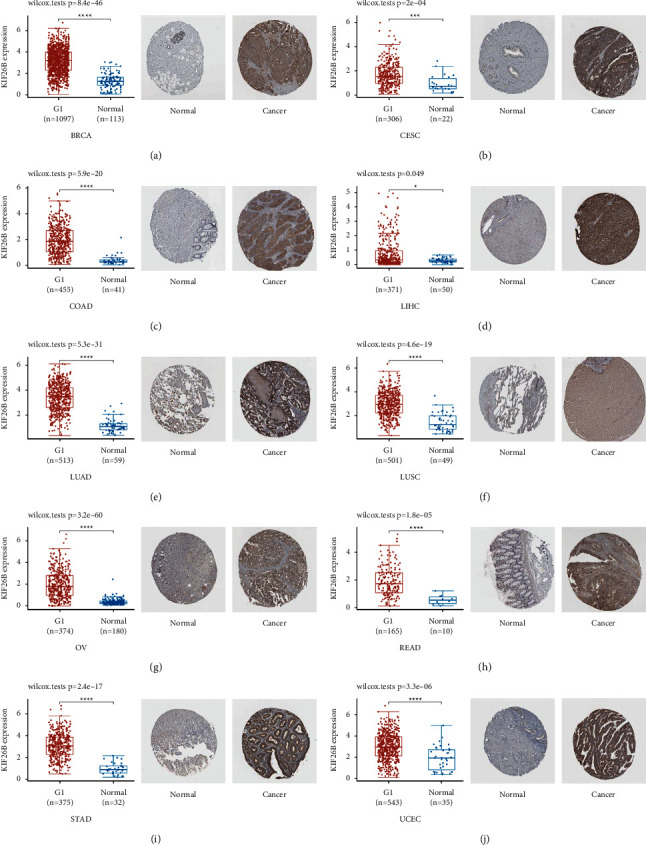
Figure 2.

Comparison of KIF26B gene expression in tumor and healthy tissues within the TCGA dataset (left). Immunohistochemistry images of normal (middle) and tumor (right) tissues. (a) BRCA. (b) CESC. (c) COAD. (d) LIHC. (e) LUAD. (f) LUSC. (g) OV. (h) READ. (i) STAD. (j) UCEC.
