Figure 1.
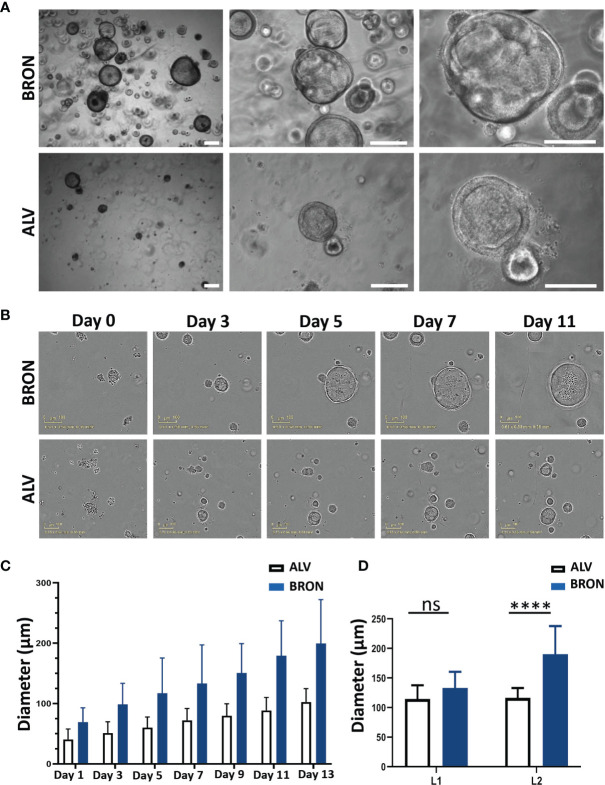
Morphology and growth pattern of established human lung organoids of bronchiolar and alveolar differentiation. (A) Representative brightfield images of organoids established in bronchiolar (upper panel) and alveolar (lower panel) differentiation culture media. Magnification, 4x left, 10x middle and 20x right. Scale bars in all images equals 250 µm. The representative images displayed here are from organoids derived from Patient L1. (B) IncuCyte Live Cell analysis system (Sartorius) was applied to assess formation of single cells into alveolar and bronchiolar differentiated organoids for 13 days. Representative images from the IncuCyte time course experiment from day 0 until day 11 is shown. Scale bar equals 100 µm. The representative images displayed here are from organoids derived from Patient L2. Link to time-lapse video showing the organoid formation in alveolar and bronchiolar differentiation media of this IncuCyte time-lapse experiment is available in Supplementary Materials (VIDEO S1 and S2) . (C) IncuCyte images of organoids from panel B were used to measure the average diameter of 10 individual alveolar and bronchiolar organoids, over 13 days, using the built-in measure tool in ImageJ. The 10 largest organoids were measured for each condition. (D) Quantification of organoid diameter from H&E-stained images from passage 2 organoids embedded at day 14 after passaging cultured in bronchiolar and alveolar differentiation medium from patients L1 and L2 was performed using the built-in measure tool in ImageJ. The ten biggest organoids were measured for each condition. Representative H&E images from patient L2 are shown in panel B (bronchiolar) and 4B (alveolar). The Mann-Whitney test was used to compare organoid diameter between ALV and BRON (ns in L1, ****P < 0.0001 in L2).

