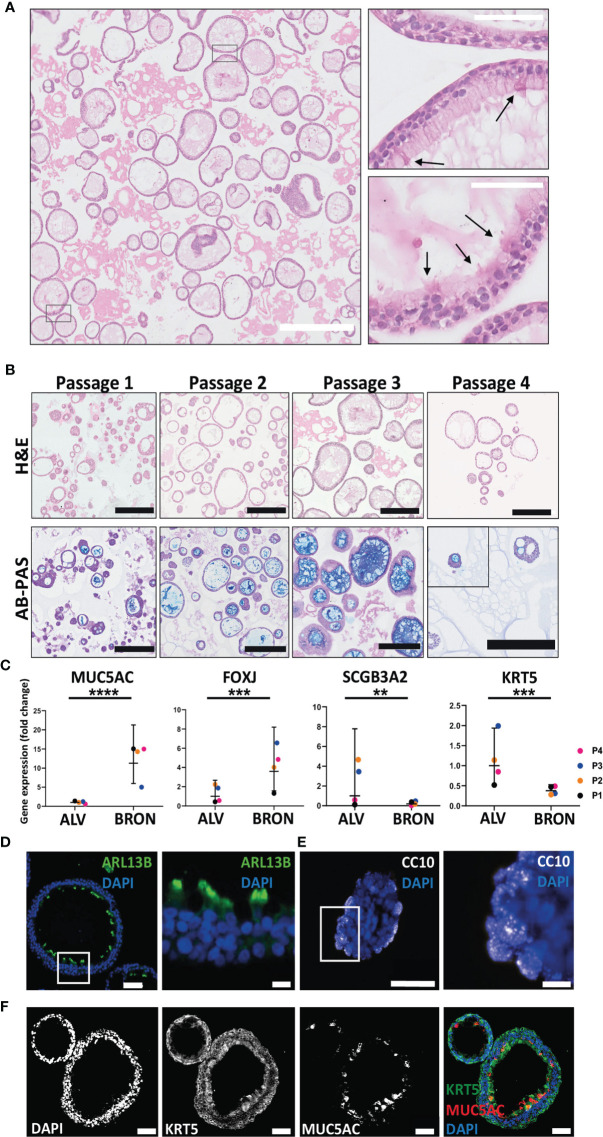
Figure 2.
Phenotypic and functional characterization of airway organoids of bronchiolar differentiation (BRON). (A) Representative hematoxylin and eosin (H&E) stained formalin fixed paraffin embedded (FFPE) sections display the histology of the organoids of bronchiolar differentiation. Of, note, ciliated cells were observed in the H&E stained FFPE sections (arrows, right zoomed inserts). Scale bar equals 100 µm (left) and 50 µm (right, zoomed inserts). The representative images displayed here are from organoids derived from Patient L2. By microscopy of the organoids in bronchiolar differentiation media in culture, the cilia were found to have a characteristic beating pulse as shown in the Supplementary Materials video (VIDEO S3) . (B) Images in upper row display the histology of the organoids of bronchiolar differentiation over the four passages (Passage 1- Passage 4). Histology is revealed by H&E-stained formalin fixed paraffin embedded (FFPE) sections. Lower row displays the functional ability of the organoids over the four passages to produce mucus. Mucus production is detected in FFPE sections through alcian blue-Periodic acid schiff (AB-PAS) histochemistry. Positive AB-PAS staining was observed in all passages (P1-P4). Scale bar equals 250 µm in all images. The representative images displayed here are from organoids derived from Patient L2. (C) Fold changes in gene expression of BRON compared to ALV organoids. Relative expression of the cell-type markers, MUC5AC (goblet cell), FOXJ1 (ciliated cell), SCGB3A2 (club cell), and KRT5 (basal cell). Relative quantification was performed using the Livac (2–ΔΔCt) method. The ALV and BRON organoids have been passaged 4 times (P1-P4) using respective differentiation medium. The mean value of three technical replicates for each passage are shown as individual points. GraphPadPrism v9 was used to calculate and display the geometric mean and 90% confidence interval of the biological replicates (passages). Statistics were performed on the ΔCt values using the Mann-Whitney test. A significant difference in gene expression were detected for MUC5AC (****P < 0.0001), FOXJ (***P = 0.0001), KRT5 (***P = 0.0001) and SCGB3A2 (**P = 0.0080) between alveolar and bronchiolar organoids. The gene expression profile shown here are from patient L2. (D) Immunofluorescent staining performed on sections from formalin fixed paraffin embedded (FFPE) tissue of bronchiolar organoids reveal the presence of ciliated cells (ARL13B). Scale bars in all images equals 50 µm. Scale bar zoomed insert equals 10 µm. (E) Immunofluorescent staining performed on sections from formalin fixed paraffin embedded (FFPE) tissue of bronchiolar organoids club cells (CC10). Scale bars equals 50 µm for left image and 10 µm for right image (zoom insert). (F) Immunofluorescent staining performed on sections from formalin fixed paraffin embedded (FFPE) tissue of bronchiolar organoids confirmed the presence of basal cells (KRT5) and secretory cells (MUC5AC). Scale bars equals 50 µm. The representative images displayed in (D–F) are from organoids derived from Patient L2.

