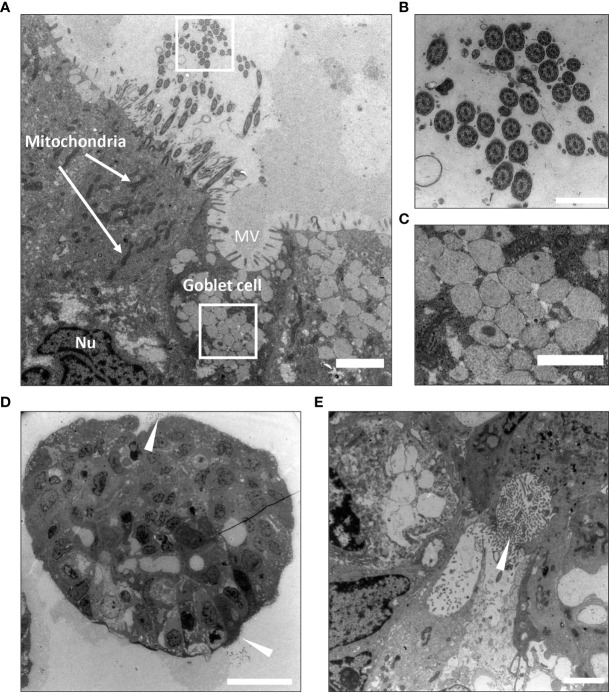
Figure 3.
Ultrastructural characterization of bronchiolar organoid tissues by Transmission Electron Microscopy (TEM). (A) Transmission electron micrograph display cross-section of a bronchiolar organoid. This image shows the characteristic pseudostratified airway epithelium, consisting of interspersed multi-ciliated and secretory goblet cells. Nu: nucleus. MV: microvilli. Scale bar equals 2000 nm. (B) Zoomed insert from (A) to show a cross-section of the motile cilia sprouting from the ciliated cell. The characteristic 9 + 2 arrangement of microtubules is clearly visible. Scale equals 500 nm. (C) Zoomed insert from (A) to show the electron-lucent granules of the secretory goblet cell. Scale bar equals 1000 nm. (D) Apical side-out orientated organoids. Ciliated cells are pointed (white arrowheads). Scale bar equals 10 µm. (E) Apical side-in orientated organoids. Ciliated cells are pointed (white arrowhead). Scale bar equals 2000 nm. The representative images displayed in these panels (A–E) are of organoids derived from Patient L1.

