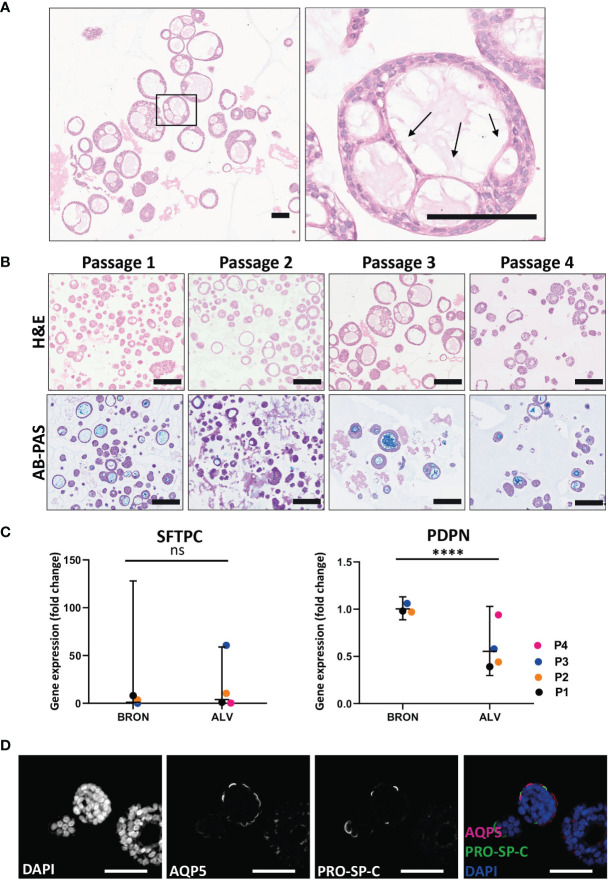
Figure 4.
Functional and phenotypic characterization of airway organoids of alveolar differentiation (ALV). (A) The morphology of thin-walled cells detected in the H&E-stained alveolar sections resemble the morphology of AT1 cells. Scale bar equals 100 µm. Black arrows point at the thin-walled cells displaying characteristic AT1 morphology. (B) Hematoxylin and eosin (H&E) (upper row) and alcian blue-Periodic acid schiff (AB-PAS) (lower row) stained FFPE sections of alveolar organoids over the four passages (Passage 1- Passage 4). Scale bar equals 200 µm. (C) Fold changes in gene expression levels of the type 2 pneumocyte (AT2) cell-type marker SFTPC and the type 1 pneumocyte (AT1) cell-type marker PDPN, in the organoids cultured in alveolar medium, that were passaged 4 times (P1-P4). Relative quantification was performed using the Livac method and alveolar organoids are normalized to the average delta Ct of bronchiolar organoids. The mean value of three technical replicates for each passage are shown as individual data points. GraphPadPrism v9 was used to calculate and display the geometric mean and 90% confidence interval of the biological replicates (passages). Statistics were performed on the delta Ct values using the Mann-Whitney test. Expression of SFTPC were 3.90 fold higher in ALV than BRON. (ns). There is a significant difference (fold change 0.55, ****P = 0.0001) in the expression of PDPN gene between the alveolar and bronchiolar organoids, the gene expression profile shown here are from patient L2. (D) Immunofluorescent staining of formalin fixed paraffin embedded (FFPE) sections of alveolar organoids showing Aquaporin 5 (AQP5) as a marker for AT1 and pro-surfactant protein C (PRO-SP-C) as a marker for AT2 cells. Scale bar equals 50 µm.

