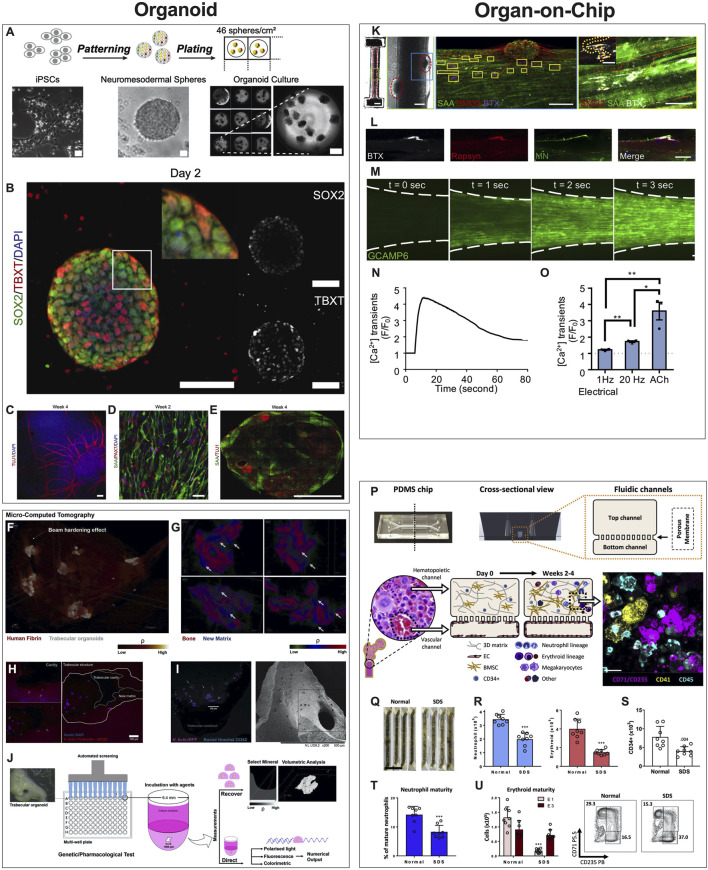
FIGURE 3.
Examples of Organoids and Organ-on-a-Chip Microphysiological Systems. (A–E) Human sensorimotor organoid model uses iPSCs cultured in suspension and allowed to self-assemble into organoids and mature in culture over several weeks (A), with immunostaining for neuronal stem cell (TUJ1), myogenic (TBXT, PAX7), neuromesodermal (SOX2/TBXT), and neurogenic (SOX2) transcription factors and the sarcomeric α-actinin (SAA) (B–E). The platform was used to test several ALS traits and their effect on the NMJ, elucidating key events and attributes of motor neuron diseases. [Reproduced from (Pereira et al., 2021) with permission]. (F–J) Trabecular bone in fibrin gel organoids (F) demonstrating bone remodeling in vitro (G) via the coupled activities of osteoblasts (H) and osteoclasts (I). This human trabecular bone organoid allows for detailed morphologic and resorption events to be studied and chemically characterized (J), including investigating the effects of microgravity on bone loss. [Reproduced from (Iordachescu et al., 2021) with permission]. (K–O) 3D neuromuscular co-culture in an organ-on-a-chip augments AChR signaling. A representative 3D skeletal muscle-motor neuron (MN) co-culture at 2 weeks (K). Neuromuscular tissue outlined with red dashed line in left panel. Representative confocal image of a 2-week old neuromuscular co-culture immunostained for sarcomeric α-actinin (SAA; green), α-bungarotoxin (BTX; magenta), and neurofilament heavy SMI-32 (red). A neuromuscular co-culture immunostained on Day 10 of differentiation for Rapsyn (red), bungarotoxin (BTX, white), and counter stained with Hoechst 33342 (blue). (L) Epifluorescence images of a GCaMP6-labeled transduced 3D muscle tissue to visualize muscle fiber calcium transients at time-points before (t = 0 s) and after (t = 1, 2, and 3 s) ACh stimulation. (M) Time course of GCaMP6 reporter fluorescence following ACh-induced stimulation of a representative 3D muscle tissue. (N) Quantification of GCaMP6 signal after 3D skeletal muscle tissue low (1 Hz) or high (20 Hz) electrical stimulation, or ACh biochemical stimulation, and relative to phosphate buffered saline treated control tissues (dotted line). (O) [Reproduced from (Afshar Bakooshli et al., 2019) with permission]. (P–U) The design of the human bone marrow on chip recapitulates human bone marrow histology through a vascular layer in contact with bone marrow derived mesenchymal stromal cells embedded in an extracellular matrix with immune cell progenitors over 2–4 weeks. (P) BM Chips seeded with CD34+ cells from normal donors versus SDS patients at 2 weeks of culture. (Q) Neutrophil [(R), left)], erythroid [(R), right], and CD34+ (S) cell numbers were quantified by flow cytometry. Percentages of neutrophils with a mature CD16hi surface phenotype in control versus SDS BM Chips were quantified by flow cytometry (T). Number of erythroid cells at different maturation states (left) and representative flow plots (right) depicting the percentages of the erythroid subpopulations (E1: immature, E3: mature), as quantified by flow cytometry (U). (Reproduced from (Chou et al., 2020) with permission).

