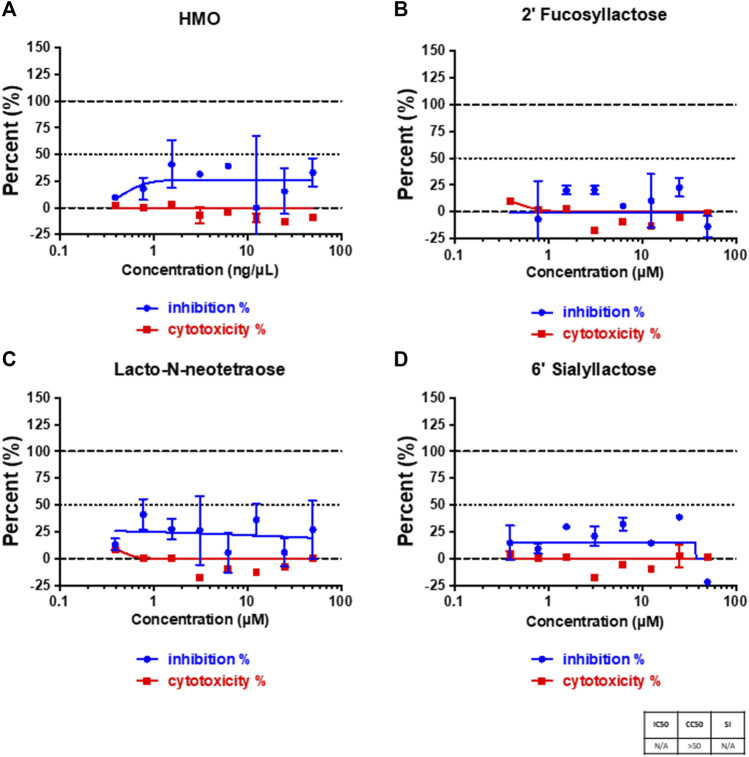
FIGURE 1.
Viral infection on cells and cytotoxicity assays. Cell plates were pre-treated with pooled HMOs (A), 2′-FL (B), LNnT (C), and 6′-SL (D), respectively. The treatment was performed for 2 h at 37°C (5% CO2) prior to infection. The percent of infected cells was determined for each well based on GFP expression. All samples were run in triplicate on both an assay plate and a toxicity plate.

