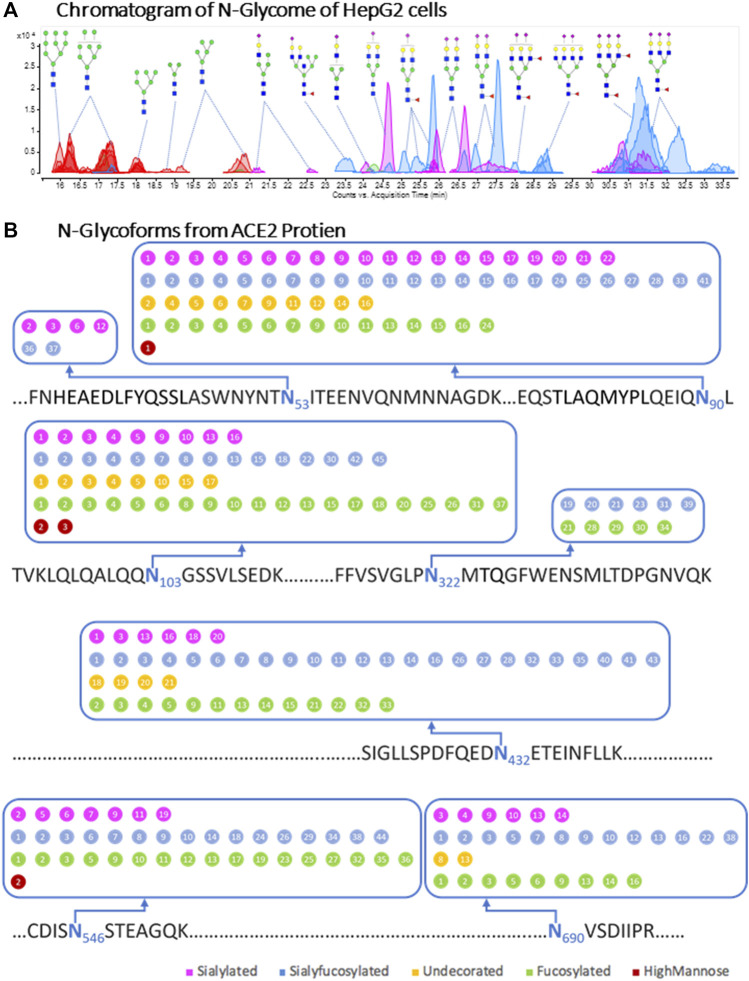
FIGURE 3.
Cell membrane N-glycome and site-specific occupancy of ACE2 receptor in HepG2 cells. (A) Individual N-glycan species of HepG2 host cells. LC-MS peaks were color coded to assign glycan subtype. Abundant peaks are annotated with putative structures. Symbol nomenclature is used for representing glycan structures (https://www.ncbi.nlm.nih.gov/glycans/snfg.html). (B) Site-specific occupancy of ACE2 receptor in HepG2 cells. The N-glycoforms from ACE2 protien extracted from HepG2 cells are distributed on seven glycosites. The labeled numbers inside dots denote identified individual glycan and the details were shown in Supplementary Table S2.

