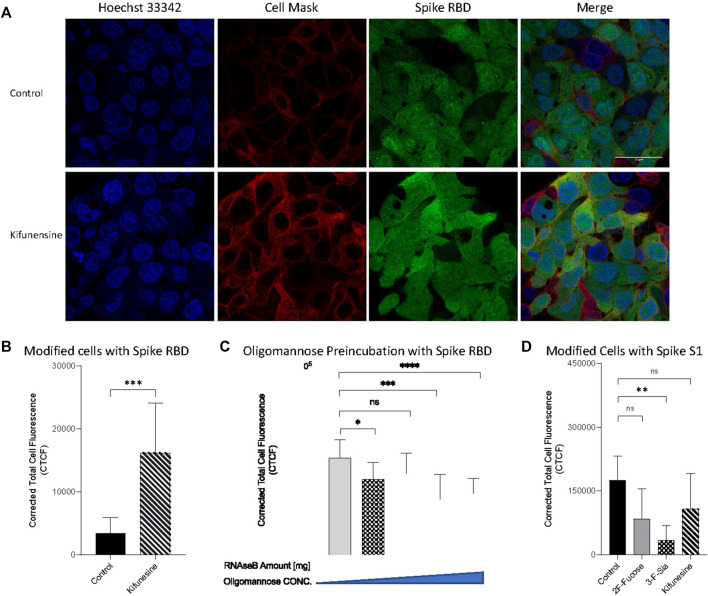
FIGURE 7.
Introducing high mannose glycans into viral binding. (A) Immunofluorescence for S protein RBD binding with modified cells. The columns (from left to right) show staining of nuclear acid (Hoechst 33342), plasma membrane (CellMask™ Deep Red), S protein RBD, and merged image. Scale bar, 600 pixels. Quantification of fluorescent intensity of spike protein RBD (B,C) or S1 subunit (D) binding. (C) Fluorescent labelled proteins were preincubated with purified high mannose at room temperature for 30 min before binding. Fluorescence intensity was quantified for selected cell area. Quantification was performed with software ImageJ. Asterisks indicate the statistical significance between groups compared (*p< 0.05%; **p< 0.01%; ***p< 0.001%; ****p< 0.0001%; ns p < 0.05).

